The Hormuz Bitcoin story just wrote its wildest chapter yet. On April 17, Iran declared the Strait of Hormuz fully open — Bitcoin exploded to $78,000. Less than 20 hours later, Iran reversed course and shut the strait again — Bitcoin crashed back to $74,000. This single Hormuz Bitcoin event erased $593 million in short positions, whipsawed oil prices by 11%, and left the Fear & Greed Index at 23 (Extreme Fear). Here is exactly what happened, what the numbers say, and what beginners should do next.
호르무즈 비트코인 이야기가 이번 주 가장 극적인 장을 썼습니다. 4월 17일 이란이 호르무즈 해협 완전 개방을 선언하자 비트코인이 $78,000까지 폭등했습니다. 그런데 20시간도 안 되어 이란이 입장을 뒤집고 해협을 재폐쇄하자 비트코인은 $74,000으로 급락했습니다. 이 한 번의 호르무즈 비트코인 이벤트로 $5.93억의 숏 포지션이 청산되고, 유가가 11% 급변했으며, 공포·탐욕 지수는 23(극단적 공포)까지 떨어졌습니다. 무슨 일이 있었는지, 숫자가 무엇을 말하는지, 초보자가 다음에 무엇을 해야 하는지 정리합니다.
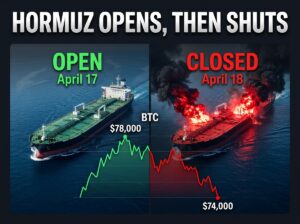
Then it all reversed. Less than 20 hours later, on April 18, Iran’s Revolutionary Guard fired on a tanker attempting to pass through the strait and reimposed the blockade. Iran’s military command declared the Hormuz would stay shut “until the US lifts its blockade on Iranian ports.” The US responded by seizing an Iranian vessel on April 19. Bitcoin dropped from $78,000 back to approximately $74,000 over the weekend, erasing most of the rally.
그런데 모든 것이 뒤집혔습니다. 20시간도 안 되어, 4월 18일 이란 혁명수비대가 해협을 통과하려는 유조선에 사격하고 봉쇄를 재부과했습니다. 이란 군사 사령부는 “미국이 이란 항구 봉쇄를 해제할 때까지” 호르무즈를 폐쇄한다고 선언했습니다. 미국은 4월 19일 이란 선박을 나포하며 대응했습니다. 비트코인은 주말 동안 $78,000에서 약 $74,000까지 하락하며 랠리의 대부분을 반납했습니다.
As of today (April 20), Bitcoin sits at approximately $74,000, oil prices are rising again, and the ceasefire deadline is only 4 days away. The Fear & Greed Index has dropped back to 23 — Extreme Fear, after briefly climbing during the Hormuz opening. Only 8 tankers made it through the strait before it was closed again.
오늘(4월 20일) 기준 비트코인은 약 $74,000, 유가는 다시 상승 중이며, 휴전 기한까지 4일밖에 남지 않았습니다. 공포·탐욕 지수는 호르무즈 개방 중 잠시 상승했다가 다시 23 — 극단적 공포로 하락했습니다. 재폐쇄 전 해협을 통과한 유조선은 단 8척에 불과합니다.
The Numbers Right Now
Here is where the market stands as we enter the new week.
새로운 한 주를 시작하는 시점의 시장 현황입니다.
Bitcoin (BTC): ~$74,000. Surged to $78,320 high on April 17, then fell to $73,820 open on April 20. The 10-week high was short-lived. Key support sits at $72,000 (February consolidation zone) and then $69,000. Resistance at $76,000 (failed reclaim) and $78,000 (this week’s high). On the Fibonacci chart from the $60K low to $126K high, BTC is struggling just below the 23.6% level ($75,576).
비트코인 (BTC): ~$74,000. 4월 17일 $78,320 고점을 찍은 후 4월 20일 $73,820 시가로 하락. 10주 최고점은 오래가지 못했습니다. 핵심 지지선은 $72,000(2월 횡보 구간)과 $69,000입니다. 저항선은 $76,000(회복 실패)과 $78,000(이번 주 고점). 피보나치 차트($60K 저점 → $126K 고점)에서 BTC는 23.6% 레벨($75,576) 바로 아래에서 고전 중입니다.
Ethereum (ETH): ~$2,350. Touched $2,464 on April 17 before sliding back. ETH dominance remains weak at around 10.8%. The correlation with Bitcoin remains tight — when BTC drops, ETH drops with it, often harder.
이더리움 (ETH): ~$2,350. 4월 17일 $2,464를 터치한 후 하락. ETH 점유율은 약 10.8%로 여전히 약세. 비트코인과의 상관관계가 높아 BTC 하락 시 ETH도 함께, 종종 더 크게 하락합니다.
Fear & Greed Index: 23 (Extreme Fear). Dropped from 29 before the Hormuz events. For context, the index hit a historic low of 5-8 in February 2026. Extreme Fear readings have historically been better buying zones than selling zones — but only if you have a plan.
공포·탐욕 지수: 23 (극단적 공포). 호르무즈 이벤트 전 29에서 하락. 참고로 2026년 2월에는 역사적 저점 5-8을 기록했습니다. 극단적 공포 구간은 역사적으로 매도보다 매수에 유리한 구간이었지만, 계획이 있을 때만 그렇습니다.
Oil prices: Rising again after the re-closure. Oil had crashed to $85.90 on the Hormuz opening news (April 17) but is climbing back. Oxford Economics warned prices could exceed $150/barrel if the strait stays closed long-term. Goldman Sachs estimated a one-month full closure adds roughly $15/barrel.
유가: 재폐쇄 이후 다시 상승 중. 호르무즈 개방 뉴스(4/17)로 $85.90까지 폭락했으나 반등하고 있습니다. Oxford Economics는 해협이 장기 폐쇄되면 유가가 배럴당 $150을 넘을 수 있다고 경고했고, Goldman Sachs는 1개월 완전 폐쇄 시 약 $15/배럴 상승을 추정했습니다.
Order book depth: Still thin. Bitcoin order book depth remains below $130 million (1% range), down ~50% from September 2025. This means every headline-driven move — like the $78K spike and $74K dump — happens with less liquidity cushion, amplifying both rallies and crashes.
오더북 깊이: 여전히 얇음. 비트코인 오더북 깊이는 $1.3억 미만(±1% 범위)으로 2025년 9월 대비 약 50% 감소. 이는 $78K 급등과 $74K 급락 같은 헤드라인 주도 움직임이 더 적은 유동성 완충으로 발생해 랠리와 폭락 모두 증폭된다는 뜻입니다.
Why This Week Was a Perfect Lesson in Trading Psychology
This week demonstrated every emotional trap we have covered on this blog. On April 17, as Bitcoin rocketed to $78K, FOMO dominated. Traders who chased the pump and bought between $77K-$78K without checking RSI (which was approaching overbought) or volume (which was concentrated in the short squeeze, not organic buying) are now holding positions at a 5% loss.
이번 주는 이 블로그에서 다룬 모든 감정적 함정을 보여주었습니다. 4월 17일 비트코인이 $78K로 급등했을 때 FOMO가 지배했습니다. RSI(과매수 접근)나 거래량(숏 스퀴즈에 집중, 유기적 매수 아님)을 확인하지 않고 $77K-$78K에서 매수한 트레이더들은 현재 5% 손실 포지션을 안고 있습니다.
Then, when Iran reversed course on April 18, panic selling kicked in. Traders who had no stop-loss watched their gains evaporate. Thin order books made the slippage on market sell orders brutal — some reported 0.5-1% worse fills than expected.
그런데 4월 18일 이란이 입장을 뒤집자 패닉 매도가 시작되었습니다. 손절을 설정하지 않은 트레이더들은 수익이 증발하는 것을 지켜봤습니다. 얇은 오더북으로 인해 시장가 매도의 슬리피지가 참혹했고, 기대보다 0.5-1% 나쁜 체결을 보고한 트레이더도 있었습니다.
The traders who came out fine this week were the ones who followed a plan: they had entries at support levels, set stop-losses, used limit orders, checked their trading journal before acting, and waited for confirmation instead of chasing headlines.
이번 주 무사히 넘긴 트레이더들은 계획을 따른 사람들이었습니다: 지지선에서 진입하고, 손절을 설정하고, 지정가 주문을 사용하고, 행동하기 전에 거래 일지를 확인하고, 헤드라인을 쫓는 대신 확인을 기다린 사람들입니다.
What Comes Next: Three Scenarios
The next 1-2 weeks hinge on the ceasefire deadline, which expires in approximately 4 days. Here are the three most likely scenarios.
향후 1-2주는 약 4일 후 만료되는 휴전 기한에 달려 있습니다. 가장 가능성 높은 세 가지 시나리오입니다.
Scenario 1 — Ceasefire extends, Hormuz reopens. If the US and Iran reach an agreement to extend the ceasefire and reopen the strait, expect a replay of April 17: oil drops, risk assets rally. Bitcoin could retest $78,000 and potentially push toward the Fibonacci 38.2% level at $85,212. This is the most bullish case.
시나리오 1 — 휴전 연장, 호르무즈 재개방. 미국과 이란이 휴전 연장 및 해협 재개방에 합의하면 4월 17일의 재현이 예상됩니다: 유가 하락, 위험 자산 랠리. 비트코인은 $78,000을 재시험하고 피보나치 38.2% 레벨 $85,212를 향해 상승할 수 있습니다. 가장 낙관적인 경우입니다.
Scenario 2 — Ceasefire expires, status quo continues. If no deal is reached but fighting does not escalate significantly, Bitcoin likely stays in the $70,000-$76,000 range. Volatility remains high but directionless. This is the “chop zone” — the worst environment for overtrading. In this scenario, patience is the best strategy, as we will discuss in an upcoming article.
시나리오 2 — 휴전 만료, 현상 유지. 합의 없이 전투가 크게 격화되지 않으면 비트코인은 $70,000-$76,000 범위에 머물 가능성이 높습니다. 변동성은 높지만 방향성이 없습니다. 이것은 “횡보 구간” — 과잉 거래에 최악의 환경입니다. 이 시나리오에서는 인내가 최선의 전략입니다.
Scenario 3 — Escalation. If the conflict escalates further — more seizures, military strikes on oil infrastructure, broader sanctions — oil could spike toward $120-$150/barrel. Bitcoin’s reaction is harder to predict. Short-term, it would likely dump with all risk assets (as in October 2025). Medium-term, however, Bitcoin historically benefits from geopolitical instability as a “neutral asset.” In this scenario, key support at $69,000 and then the February low of $60,000 become critical.
시나리오 3 — 격화. 분쟁이 더 격화되면 — 추가 나포, 석유 시설 군사 공격, 광범위한 제재 — 유가가 $120-$150/배럴을 향해 급등할 수 있습니다. 비트코인의 반응은 예측이 어렵습니다. 단기적으로는 모든 위험 자산과 함께 하락할 가능성이 높습니다(2025년 10월처럼). 중기적으로는 비트코인이 역사적으로 지정학적 불안정성에서 “중립 자산”으로 혜택을 받아왔습니다. 이 시나리오에서 핵심 지지선 $69,000과 2월 저점 $60,000이 결정적입니다.
What Beginners Should Do Right Now
The worst thing you can do this week is make an emotional decision. Here is a concrete checklist.
이번 주 할 수 있는 최악의 일은 감정적 결정을 내리는 것입니다. 구체적인 체크리스트입니다.
Do not chase. If Bitcoin spikes $3,000 in an hour on a headline, do not buy. Wait at least 30 minutes, check RSI and volume, and look at the order book for genuine buying pressure vs. spoofed walls.
쫓지 마세요. 헤드라인으로 비트코인이 1시간에 $3,000 급등하면 매수하지 마세요. 최소 30분 기다리고, RSI와 거래량을 확인하고, 오더북에서 진짜 매수 압력과 스푸핑 벽을 구분하세요.
Keep stablecoins ready. Hold at least 15-20% of your portfolio in USDT or USDC. If a genuine opportunity appears at support — for example, BTC dipping to $69,000 with RSI below 30 — you need dry powder to act.
스테이블코인을 준비하세요. 포트폴리오의 최소 15-20%를 USDT 또는 USDC로 보유하세요. 지지선에서 진짜 기회가 나타나면 — 예: BTC가 $69,000으로 하락하고 RSI가 30 미만 — 행동할 여유 자금이 필요합니다.
Set alerts, not market orders. Set price alerts at $72,000 (support test), $76,000 (breakout attempt), and $69,000 (deeper support). When an alert triggers, analyze first, then decide. Never place a market order during a news spike — use limit orders to avoid slippage.
시장가 주문이 아닌 알림을 설정하세요. $72,000(지지선 테스트), $76,000(돌파 시도), $69,000(더 깊은 지지)에 가격 알림을 설정하세요. 알림이 울리면 먼저 분석한 후 결정하세요. 뉴스 급등 중에 절대 시장가 주문을 넣지 마세요 — 슬리피지를 피하려면 지정가 주문을 사용하세요.
If you already have open positions: Review your stop-losses immediately. Make sure they are active and set at levels that protect your capital. Check your portfolio balance — if one asset has become overweight due to price changes, consider rebalancing.
이미 열린 포지션이 있다면: 즉시 손절을 확인하세요. 활성화되어 있고 자본을 보호하는 수준에 설정되어 있는지 확인하세요. 포트폴리오 균형을 점검하세요 — 가격 변동으로 한 자산이 비중 초과되었다면 리밸런싱을 고려하세요.
Log everything in your trading journal. Weeks like this generate the most valuable journal entries. Record what you felt, what you did, and what happened. A month from now, this data will be gold.
모든 것을 거래 일지에 기록하세요. 이런 주에 가장 가치 있는 일지 항목이 생깁니다. 무엇을 느꼈는지, 무엇을 했는지, 무슨 일이 일어났는지 기록하세요. 한 달 후 이 데이터가 보물이 될 것입니다.
The Bigger Picture
Step back from the daily noise. Bitcoin hit an all-time high of $126,000 in October 2025. It crashed to $60,000 by February 2026. It has since recovered to the $70,000-$78,000 range. The market is in a recovery phase, but it is being jerked around by geopolitics — something no chart can predict.
일간 소음에서 한 발 물러서세요. 비트코인은 2025년 10월 $126,000 사상 최고가를 기록했고, 2026년 2월 $60,000까지 폭락했으며, 이후 $70,000-$78,000 범위로 회복했습니다. 시장은 회복 단계에 있지만, 어떤 차트도 예측할 수 없는 지정학에 의해 흔들리고 있습니다.
What you can control: your position size, your stop-losses, your emotional discipline, and your willingness to sit on your hands when the market is chaos. The tools you have learned — RSI, MACD, Fibonacci, Bollinger Bands, volume, order book reading — are not magic. They are filters that help you make decisions with data instead of emotion. Use them.
당신이 통제할 수 있는 것: 포지션 크기, 손절, 감정적 규율, 시장이 혼란일 때 가만히 있을 의지. 배운 도구들 — RSI, MACD, 피보나치, 볼린저 밴드, 거래량, 오더북 읽기 — 는 마법이 아닙니다. 감정 대신 데이터로 결정을 내리도록 돕는 필터입니다. 사용하세요.
Stay calm. Stay disciplined. Practice on Tapbit with small positions and clear plans.
침착하세요. 규율을 유지하세요. Tapbit에서 소액 포지션과 명확한 계획으로 연습하세요.
Disclosure: This article contains affiliate links. We may earn a commission at no extra cost to you.
공개: 이 글에는 제휴 링크가 포함되어 있습니다. 추가 비용 없이 커미션을 받을 수 있습니다.