지지선(Support)은 가격이 하락하다가 매수세가 몰려 더 이상 내려가지 않는 가격대이고, 저항선(Resistance)은 가격이 상승하다가 매도세가 몰려 더 이상 올라가지 않는 가격대입니다. 이 두 레벨은 차트에서 가격이 반복적으로 반등하거나 막히는 지점을 수평선으로 연결하여 찾습니다. 지지선이 깨지면 새로운 저항선이 되고, 저항선이 깨지면 새로운 지지선이 됩니다. RSI, MACD, 캔들스틱 패턴과 결합하면 진입·퇴출 시점의 정확도가 크게 높아집니다.
Every price movement on a chart is a battle between buyers and sellers. Support and resistance are the invisible lines where those battles are most intense — and learning to find them is one of the most valuable skills you can develop as a crypto trader.
차트의 모든 가격 움직임은 매수자와 매도자 간의 전투입니다. 지지선과 저항선은 그 전투가 가장 치열한 보이지 않는 선이며 — 이를 찾는 법을 배우는 것은 암호화폐 트레이더로서 개발할 수 있는 가장 가치 있는 기술 중 하나입니다.
What Support Means and Why Prices Bounce Off It
Support is a price level where buying pressure consistently overcomes selling pressure, causing the price to stop falling and bounce back up. Think of it as a floor beneath the price. Every time the price drops to that level, enough buyers step in to push it back up.
지지선은 매수 압력이 지속적으로 매도 압력을 극복하여 가격이 더 이상 하락하지 않고 다시 반등하는 가격대입니다. 가격 아래의 바닥이라고 생각하세요. 가격이 그 수준으로 떨어질 때마다 충분한 매수자가 진입하여 가격을 다시 밀어올립니다.
For example, if Bitcoin drops to $60,000 three times over the past two months and bounces back up each time, $60,000 is a strong support level. The more times a price bounces off the same level, the stronger that support becomes — because more traders recognize it and place buy orders there.
예를 들어, 비트코인이 지난 두 달간 세 번 $60,000까지 떨어졌다가 매번 반등했다면, $60,000은 강한 지지선입니다. 같은 레벨에서 가격이 더 많이 반등할수록 지지선은 더 강해집니다 — 더 많은 트레이더가 이를 인식하고 그곳에 매수 주문을 놓기 때문입니다.
Support exists because of human psychology. Traders who missed the previous bounce at $60,000 set buy orders there hoping to catch the next one. Traders who already bought at $60,000 before see it as validation of their decision and buy more. This clustering of buy orders creates a self-reinforcing floor.
지지선은 인간 심리 때문에 존재합니다. 이전 $60,000 반등을 놓친 트레이더는 다음 번을 잡기 위해 그곳에 매수 주문을 설정합니다. 이전에 $60,000에서 이미 매수한 트레이더는 자신의 결정이 타당했음을 확인하고 더 매수합니다. 이 매수 주문의 집중이 자기 강화적 바닥을 만듭니다.
What Resistance Means and Why Prices Get Rejected
Resistance is the opposite — a price level where selling pressure consistently overcomes buying pressure, causing the price to stop rising and pull back down. Think of it as a ceiling above the price.
저항선은 반대입니다 — 매도 압력이 지속적으로 매수 압력을 극복하여 가격이 더 이상 상승하지 않고 다시 내려오는 가격대입니다. 가격 위의 천장이라고 생각하세요.
If Bitcoin rises to $73,000 twice in the past month and gets rejected both times, $73,000 is a resistance level. Sellers are concentrated at that price — some are taking profits, others are opening short positions, and the combined selling pressure overwhelms the buyers.
비트코인이 지난 한 달간 두 번 $73,000까지 상승했다가 두 번 다 거부당했다면, $73,000은 저항선입니다. 매도자가 그 가격에 집중되어 있습니다 — 일부는 수익을 실현하고, 다른 일부는 숏 포지션을 열고 있으며, 결합된 매도 압력이 매수자를 압도합니다.
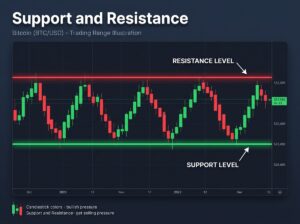
In the current market, Bitcoin has been bouncing between roughly $60,000 support and $73,000 resistance since the Iran war began. Understanding these two levels gives you a clear framework for decision-making — buy near support, be cautious near resistance.
현재 시장에서 비트코인은 이란 전쟁 시작 이후 대략 $60,000 지지선과 $73,000 저항선 사이에서 오가고 있습니다. 이 두 레벨을 이해하면 의사결정을 위한 명확한 프레임워크를 갖게 됩니다 — 지지선 부근에서 매수, 저항선 부근에서 신중하게.
How to Find Support and Resistance on a Chart
Open any crypto chart on TradingView and zoom out to see at least three to six months of price history. Look for price levels where the chart shows repeated bounces or rejections — points where the price touched the same area multiple times and reversed direction.
TradingView에서 아무 암호화폐 차트를 열고 최소 3~6개월의 가격 이력이 보이도록 축소하세요. 차트에서 반복적인 반등이나 거부가 보이는 가격 레벨을 찾으세요 — 가격이 같은 영역을 여러 번 터치하고 방향을 바꾼 지점입니다.
Draw a horizontal line at each of these levels using TradingView’s line tool. You do not need to be exact to the dollar — support and resistance are zones, not precise numbers. A support zone might be $59,500 to $60,500 rather than exactly $60,000. The more touch points a level has, the more significant it is.
TradingView의 선 도구를 사용하여 이 각 레벨에 수평선을 그리세요. 달러 단위까지 정확할 필요는 없습니다 — 지지선과 저항선은 정확한 숫자가 아닌 영역입니다. 지지 영역은 정확히 $60,000이 아니라 $59,500~$60,500일 수 있습니다. 레벨의 터치 포인트가 많을수록 더 의미 있습니다.
Focus on levels with at least two or three touches. A single bounce might be random, but three bounces at the same price creates a pattern that thousands of traders are watching.
최소 두세 번의 터치가 있는 레벨에 집중하세요. 한 번의 반등은 우연일 수 있지만, 같은 가격에서 세 번의 반등은 수천 명의 트레이더가 주시하는 패턴을 만듭니다.
The Role Reversal Principle — When Support Becomes Resistance
One of the most powerful concepts in technical analysis is that broken support becomes resistance, and broken resistance becomes support. This happens because of the psychology of trapped traders.
기술적 분석에서 가장 강력한 개념 중 하나는 깨진 지지선이 저항선이 되고, 깨진 저항선이 지지선이 된다는 것입니다. 이는 갇힌 트레이더의 심리 때문에 발생합니다.
When Bitcoin breaks below a $60,000 support level, everyone who bought at $60,000 is now holding a losing position. If the price recovers back to $60,000, many of these traders will sell to “break even” and escape their losing trade. This wave of selling at the old support level turns it into a new resistance level.
비트코인이 $60,000 지지선 아래로 무너지면, $60,000에서 매수한 모든 사람이 이제 손실 포지션을 보유하게 됩니다. 가격이 $60,000으로 다시 회복되면, 이 트레이더 중 많은 사람이 “본전”에 매도하여 손실 거래에서 벗어나려 합니다. 이전 지지선에서의 이 매도 물결이 그것을 새로운 저항선으로 바꿉니다.
The reverse is also true. When Bitcoin breaks above $73,000 resistance, that level often becomes new support because traders who missed the breakout set buy orders there, hoping to enter on a pullback.
반대도 마찬가지입니다. 비트코인이 $73,000 저항선을 돌파하면, 돌파를 놓친 트레이더들이 되돌림 시 진입하기 위해 그곳에 매수 주문을 설정하므로 그 레벨이 종종 새로운 지지선이 됩니다.
Combining Support and Resistance With Your Other Tools
Support and resistance levels become exponentially more powerful when combined with the indicators you have already learned. Here is how to build a complete analysis.
지지선과 저항선은 이미 배운 지표들과 결합하면 기하급수적으로 더 강력해집니다. 완전한 분석을 구축하는 방법은 다음과 같습니다.
When the price approaches a support level, check if RSI is in the oversold zone below 30. If it is, the probability of a bounce increases significantly. Then look for a bullish candlestick pattern like a Hammer or Morning Star forming right at that support level. Finally, check if MACD is showing a bullish crossover. When support, RSI, candlestick confirmation, and MACD all align, you have one of the highest-probability trade setups available.
가격이 지지선에 접근할 때, RSI가 30 이하 과매도 영역에 있는지 확인하세요. 그렇다면 반등 확률이 크게 높아집니다. 그런 다음 해머나 모닝스타 같은 강세 캔들스틱 패턴이 그 지지선에서 형성되는지 확인하세요. 마지막으로 MACD가 강세 교차를 보여주는지 확인하세요. 지지선, RSI, 캔들스틱 확인, MACD가 모두 정렬되면 사용 가능한 가장 높은 확률의 거래 셋업 중 하나를 갖게 됩니다.
The same logic applies at resistance. If the price hits resistance while RSI is above 70, a bearish candlestick pattern like a Shooting Star appears, and MACD shows a bearish crossover — that is a strong signal to take profits or tighten your stop-loss.
저항선에서도 같은 논리가 적용됩니다. RSI가 70 이상인 상태에서 가격이 저항선에 도달하고, 슈팅스타 같은 약세 캔들스틱 패턴이 나타나며, MACD가 약세 교차를 보여주면 — 수익을 실현하거나 손절을 타이트하게 해야 한다는 강한 신호입니다.
Common Mistakes Beginners Make With Support and Resistance
The first mistake is drawing too many lines. If your chart looks like a grid of horizontal lines, you have too many levels and none of them are useful. Focus on the two or three most obvious levels that stand out on the weekly and daily charts. If a level is not immediately visible when you zoom out, it is probably not significant enough to trade.
첫 번째 실수는 너무 많은 선을 그리는 것입니다. 차트가 수평선의 격자처럼 보인다면 너무 많은 레벨이 있고 어느 것도 유용하지 않습니다. 주간 및 일간 차트에서 눈에 띄는 가장 명확한 두세 개의 레벨에 집중하세요.
The second mistake is treating support and resistance as exact prices. They are zones, not lines. The price might wick through a support level by $200 before bouncing. This does not mean support “broke” — it means the zone was tested. Only consider support broken when the price closes convincingly below the zone on the daily chart, not just briefly touches it with a wick.
두 번째 실수는 지지선과 저항선을 정확한 가격으로 취급하는 것입니다. 그것들은 선이 아니라 영역입니다. 가격이 반등하기 전에 지지선을 $200 관통할 수 있습니다. 이것은 지지선이 “깨졌다”는 뜻이 아니라 영역이 테스트되었다는 뜻입니다.
The third mistake is ignoring the time frame. Support on a 15-minute chart is far less reliable than support on the daily or weekly chart. As a beginner, identify your key levels on the daily chart and use lower time frames only for fine-tuning your entry.
세 번째 실수는 시간 프레임을 무시하는 것입니다. 15분 차트의 지지선은 일간 또는 주간 차트의 지지선보다 훨씬 덜 신뢰할 수 있습니다. 초보자로서 일간 차트에서 핵심 레벨을 파악하고, 더 낮은 시간 프레임은 진입을 미세 조정하는 데만 사용하세요.
If you want to practice drawing support and resistance levels on live charts, Tapbit offers built-in charting tools that make it easy to analyze any trading pair in real time.
실시간 차트에서 지지선과 저항선 그리기를 연습하고 싶다면, Tapbit이 어떤 거래 페어든 실시간으로 분석하기 쉬운 내장 차트 도구를 제공합니다.
Ready to start your crypto journey? Sign up for Tapbit and begin trading today.
Disclosure: This article contains affiliate links. We may earn a small commission at no extra cost to you.