Here is a truth most beginners ignore: you do not need to win most of your trades to make money. You just need your winners to be bigger than your losers. That is exactly what the risk-reward ratio (R:R) measures — how much you stand to gain versus how much you risk losing on every single trade. A trader with a 40% win rate and a 1:3 R:R ratio makes more money than a trader with a 60% win rate and a 1:1 R:R ratio. Understanding this concept will fundamentally change how you approach trading.
대부분의 초보자가 무시하는 진실이 있습니다: 돈을 벌기 위해 대부분의 거래에서 이길 필요가 없습니다. 이긴 거래가 진 거래보다 크기만 하면 됩니다. 이것이 **위험 대비 보상 비율(R:R)**이 측정하는 것입니다 — 매 거래에서 얻을 수 있는 이익 대비 감수하는 손실. 승률 40%에 1:3 R:R인 트레이더가 승률 60%에 1:1 R:R인 트레이더보다 더 많은 돈을 법니다. 이 개념을 이해하면 거래 접근 방식이 근본적으로 바뀝니다.
What Is the Risk-Reward Ratio?
The risk-reward ratio compares the distance from your entry to your stop-loss (your risk) against the distance from your entry to your profit target (your reward).
위험 대비 보상 비율은 진입가에서 손절까지의 거리(위험)와 진입가에서 수익 목표까지의 거리(보상)를 비교합니다.
Formula: R:R = (Entry Price – Stop-Loss) : (Profit Target – Entry Price)
공식: R:R = (진입가 – 손절가) : (수익 목표 – 진입가)
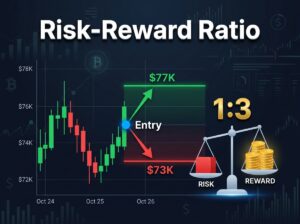
For example, you buy Bitcoin at $74,000. You set your stop-loss at $73,000 (risking $1,000). You set your profit target at $76,000 (potential gain of $2,000). Your risk-reward ratio is $1,000 : $2,000, or 1:2. This means for every $1 you risk, you aim to make $2.
예를 들어 비트코인을 $74,000에 매수합니다. 손절을 $73,000으로 설정(위험 $1,000). 수익 목표를 $76,000으로 설정(잠재 이익 $2,000). 위험 대비 보상 비율은 $1,000 : $2,000, 즉 1:2입니다. $1를 위험에 노출할 때마다 $2를 벌겠다는 뜻입니다.
Why R:R Matters More Than Win Rate
Most beginners obsess over win rate — “I want to win 80% of my trades.” But win rate alone tells you nothing about profitability. Here is why.
대부분의 초보자는 승률에 집착합니다 — “80% 이기고 싶다.” 하지만 승률만으로는 수익성을 알 수 없습니다. 그 이유입니다.
Trader A: 60% win rate, 1:1 R:R. Out of 100 trades risking $100 each: 60 wins × $100 = $6,000 gained. 40 losses × $100 = $4,000 lost. Net profit: $2,000.
트레이더 A: 승률 60%, R:R 1:1. $100씩 위험을 건 100건 거래: 60승 × $100 = $6,000 이익. 40패 × $100 = $4,000 손실. 순이익: $2,000.
Trader B: 40% win rate, 1:3 R:R. Out of 100 trades risking $100 each: 40 wins × $300 = $12,000 gained. 60 losses × $100 = $6,000 lost. Net profit: $6,000.
트레이더 B: 승률 40%, R:R 1:3. $100씩 위험을 건 100건 거래: 40승 × $300 = $12,000 이익. 60패 × $100 = $6,000 손실. 순이익: $6,000.
Trader B wins less often but makes three times more money. This is the power of risk-reward ratios. You can be wrong more than half the time and still be very profitable — as long as your winners are significantly bigger than your losers.
트레이더 B는 덜 자주 이기지만 3배 더 많은 돈을 법니다. 이것이 위험 대비 보상 비율의 힘입니다. 절반 이상 틀려도 매우 수익적일 수 있습니다 — 이긴 거래가 진 거래보다 훨씬 크기만 하면.
The Breakeven Win Rates
Each R:R ratio has a mathematical breakeven point — the minimum win rate needed to avoid losing money (before fees). Knowing these numbers helps you decide whether a trade setup is worth taking.
각 R:R 비율에는 수학적 손익분기점 — 손실을 피하기 위해 필요한 최소 승률(수수료 제외) — 이 있습니다. 이 수치를 알면 거래 셋업이 가져갈 가치가 있는지 판단하는 데 도움됩니다.
1:1 ratio — You risk $1 to make $1. Breakeven win rate: 50%. You need to win more than half your trades just to break even. After fees and slippage, you actually need about 53-55%. This is a difficult path to profitability.
1:1 비율 — $1을 위험에 노출해 $1을 벌겠다. 손익분기 승률: 50%. 손익분기를 맞추려면 절반 이상 이겨야 합니다. 수수료와 슬리피지 후에는 실제로 약 53-55%가 필요합니다. 수익성 달성이 어렵습니다.
1:2 ratio — You risk $1 to make $2. Breakeven win rate: 33.3%. You only need to win 1 out of 3 trades. At 40% win rate, you are comfortably profitable. This is the minimum recommended ratio for beginners, according to JournalPlus and most crypto risk management guides in 2026.
1:2 비율 — $1을 위험에 노출해 $2를 벌겠다. 손익분기 승률: 33.3%. 3건 중 1건만 이기면 됩니다. 승률 40%이면 안정적으로 수익을 냅니다. 2026년 JournalPlus 및 대부분의 암호화폐 위험 관리 가이드에 따르면 초보자에게 최소 권장 비율입니다.
1:3 ratio — You risk $1 to make $3. Breakeven win rate: 25%. You can lose 3 out of 4 trades and still break even. This is the sweet spot for swing trading crypto, where volatility can deliver large moves in your favor.
1:3 비율 — $1을 위험에 노출해 $3을 벌겠다. 손익분기 승률: 25%. 4건 중 3건을 져도 손익분기를 맞춥니다. 변동성이 큰 움직임을 만들어주는 암호화폐 스윙 트레이딩의 최적 비율입니다.
Rule for beginners: Never enter a trade with a risk-reward ratio below 1:2. If your analysis shows the profit target is closer than your stop-loss, the trade is not worth taking — no matter how good the setup looks.
초보자 규칙: 위험 대비 보상 비율이 1:2 미만인 거래에는 절대 진입하지 마세요. 분석 결과 수익 목표가 손절보다 가깝다면, 셋업이 아무리 좋아 보여도 거래할 가치가 없습니다.
How to Calculate R:R in Practice: Step-by-Step
Let us walk through a real example using current market conditions. Bitcoin is trading at approximately $74,000. You have identified support at $72,000 and resistance at $78,000 (this week’s high from the Hormuz opening).
현재 시장 조건을 사용한 실전 예시를 단계별로 살펴봅시다. 비트코인이 약 $74,000에 거래 중입니다. 지지선 $72,000과 저항선 $78,000(호르무즈 개방 시 이번 주 고점)을 식별했습니다.
Step 1 — Identify your entry. You plan to buy at $74,000 after confirming RSI is below 45 and volume is stable.
Step 2 — Set your stop-loss. Place it below the nearest support level: $71,500 (giving $72,000 support some breathing room). Your risk per unit = $74,000 – $71,500 = $2,500.
2단계 — 손절 설정. 가장 가까운 지지선 아래에 설정: $71,500 ($72,000 지지에 여유를 줌). 단위당 위험 = $74,000 – $71,500 = $2,500.
Step 3 — Set your profit target. The nearest resistance is $78,000, but to be conservative use $77,000 (slightly below resistance to increase fill probability). Your reward per unit = $77,000 – $74,000 = $3,000.
3단계 — 수익 목표 설정. 가장 가까운 저항이 $78,000이지만, 보수적으로 $77,000 사용(저항 약간 아래로 체결 확률 증가). 단위당 보상 = $77,000 – $74,000 = $3,000.
Step 4 — Calculate R:R. Risk $2,500 : Reward $3,000 = 1:1.2. This is below the 1:2 minimum. What do you do?
4단계 — R:R 계산. 위험 $2,500 : 보상 $3,000 = 1:1.2. 1:2 최소 기준 미달. 어떻게 할까요?
Step 5 — Adjust or skip. You have two options. Option A: tighten your stop-loss to $73,000 (risk becomes $1,000, R:R becomes 1:3 — excellent, but you risk getting stopped out more easily). Option B: skip this trade and wait for a better entry closer to $72,000 support, which would give you risk of $500 and reward of $5,000 (R:R = 1:10). The patient trader who waits for the better entry wins.
5단계 — 조정 또는 건너뛰기. 두 가지 옵션이 있습니다. 옵션 A: 손절을 $73,000으로 좁힘(위험 $1,000, R:R 1:3 — 훌륭하지만 손절에 걸릴 확률 증가). 옵션 B: 이 거래를 건너뛰고 $72,000 지지선에 더 가까운 진입을 기다림(위험 $500, 보상 $5,000, R:R = 1:10). 더 나은 진입을 기다리는 인내심 있는 트레이더가 이깁니다.
Combining R:R with the 1-2% Rule
The risk-reward ratio tells you the quality of a trade. The 1-2% rule tells you the quantity — how much capital to risk. Together, they form a complete risk management system.
위험 대비 보상 비율은 거래의 질을 알려줍니다. 1-2% 규칙은 양을 알려줍니다 — 얼마나 많은 자본을 위험에 노출할지. 함께 사용하면 완전한 리스크 관리 시스템이 됩니다.
Example: You have $5,000 capital. Using the 1% rule, your maximum risk per trade is $50. You plan to buy BTC at $74,000 with a stop-loss at $73,000 (risk = $1,000 per BTC). Position size = $50 ÷ $1,000 = 0.05 BTC (~$3,700). Your profit target is $77,000 (reward = $3,000 per BTC). On 0.05 BTC, your potential profit is $150. Your R:R is 1:3. If you win, you gain 3% of your capital. If you lose, you lose only 1%. You can afford to lose three times in a row and still have capital to trade.
예시: 자본 $5,000. 1% 규칙으로 거래당 최대 위험 $50. BTC를 $74,000에 매수, 손절 $73,000 (BTC당 위험 = $1,000). 포지션 크기 = $50 ÷ $1,000 = 0.05 BTC (~$3,700). 수익 목표 $77,000 (BTC당 보상 = $3,000). 0.05 BTC 기준 잠재 수익 $150. R:R은 1:3. 이기면 자본의 3%를 얻고, 지면 1%만 잃습니다. 3번 연속 져도 거래할 자본이 남습니다.
Where to Find Your Targets and Stops
The R:R ratio is only as good as the levels you base it on. Random numbers do not work. Use these tools to set meaningful stop-loss and profit target levels.
R:R 비율은 기반이 되는 레벨만큼만 좋습니다. 무작위 숫자는 효과가 없습니다. 의미 있는 손절과 수익 목표를 설정하려면 다음 도구를 사용하세요.
Stop-loss placement: Set your stop below a support level, below a Fibonacci retracement level, or below a moving average on the daily chart. Give it a small buffer (0.5-1% below the level) so you are not stopped out by normal price noise. Never place a stop-loss at an arbitrary round number like “2% below my entry” without checking the chart.
손절 설정: 지지선, 피보나치 되돌림 레벨, 또는 일간 차트의 이동평균 아래에 손절을 설정하세요. 일반적인 가격 노이즈에 걸리지 않도록 레벨보다 0.5-1% 아래에 약간의 여유를 두세요. 차트를 확인하지 않고 “진입가 2% 아래”처럼 임의의 숫자에 손절을 넣지 마세요.
Profit target placement: Set your target below a resistance level, below a Fibonacci level, at a previous swing high, or where Bollinger Bands upper band sits. Place it slightly below the level (not exactly on it) to increase your chances of getting filled before the price reverses.
수익 목표 설정: 저항선, 피보나치 레벨, 이전 스윙 하이, 또는 볼린저 밴드 상단 근처에 목표를 설정하세요. 가격이 반전하기 전에 체결될 확률을 높이기 위해 레벨 바로 아래(정확히 위가 아닌)에 설정하세요.
The Pre-Trade R:R Checklist
Before every trade, run through these five questions. Is my R:R at least 1:2? Is my stop-loss placed at a meaningful technical level (not arbitrary)? Is my profit target placed below a confirmed resistance or Fibonacci level? Does the 1-2% rule allow this position size? Have I confirmed the setup with at least one other indicator (RSI, volume, MACD)? If any answer is “no,” adjust the trade or skip it entirely.
매 거래 전 다섯 가지를 점검하세요. R:R이 최소 1:2인가? 손절이 의미 있는 기술적 레벨에 설정되어 있는가(임의적이지 않은)? 수익 목표가 확인된 저항선 또는 피보나치 레벨 아래에 있는가? 1-2% 규칙이 이 포지션 크기를 허용하는가? 최소 하나의 다른 지표(RSI, 거래량, MACD)로 셋업을 확인했는가? 하나라도 “아니오”이면 거래를 조정하거나 건너뛰세요.
Common R:R Mistakes
Mistake 1: Moving your stop-loss further away after entry. You set a stop at $73,000, the price drops to $73,100, and you panic — moving the stop to $72,000 “just in case.” You have just doubled your risk and destroyed your R:R. Once set, do not move your stop-loss further from your entry. You may move it closer (trailing stop) as the trade moves in your favor, but never further away.
실수 1: 진입 후 손절을 더 멀리 옮기기. $73,000에 손절을 설정했는데 가격이 $73,100까지 하락하자 패닉하여 “혹시 몰라” $72,000으로 옮깁니다. 위험을 두 배로 늘리고 R:R을 망친 것입니다. 한번 설정하면 손절을 진입가에서 더 멀리 옮기지 마세요. 거래가 유리하게 움직이면 더 가깝게(트레일링 스탑) 옮길 수 있지만, 더 멀리는 절대 안 됩니다.
Mistake 2: Taking profits too early. You set a 1:3 target, but the price moves 1:1 in your favor and you close because you are scared of losing the gain. Now your effective R:R is 1:1, and you need a 50%+ win rate to be profitable. If you are tempted, consider partial profit-taking — close half at 1:1.5 and let the other half ride to the full target.
실수 2: 수익을 너무 일찍 실현하기. 1:3 목표를 설정했는데 가격이 1:1만큼 유리하게 움직이자 이익을 잃을까 두려워 청산합니다. 실효 R:R이 1:1이 되어 수익성을 위해 50% 이상 승률이 필요합니다. 유혹되면 부분 수익 실현을 고려하세요 — 1:1.5에서 절반 청산, 나머지는 전체 목표까지 보유.
Mistake 3: Ignoring R:R because of “conviction.” “I am so sure BTC is going up that R:R does not matter.” This is FOMO disguised as confidence. Even the best analysts are wrong regularly. The R:R ratio exists precisely for when you are wrong — it limits the damage.
실수 3: “확신” 때문에 R:R 무시. “BTC가 오를 거라고 너무 확신해서 R:R은 상관없다.” 이것은 자신감으로 위장한 FOMO입니다. 최고의 분석가도 정기적으로 틀립니다. R:R 비율은 정확히 틀렸을 때를 위해 존재합니다 — 피해를 제한합니다.
Mistake 4: Using R:R without checking the chart. A 1:5 R:R looks amazing on paper — until you realize there are three major resistance levels between your entry and target. The price has almost no chance of reaching your target without significant pullbacks. Always verify that the path to your target is realistic by checking support/resistance, Fibonacci levels, and order book depth.
실수 4: 차트 확인 없이 R:R 사용. 1:5 R:R이 서류상 대단해 보이지만, 진입과 목표 사이에 주요 저항선이 3개 있다는 것을 알면 다릅니다. 상당한 조정 없이 목표에 도달할 가능성이 거의 없습니다. 항상 지지·저항, 피보나치 레벨, 오더북 깊이를 확인하여 목표까지의 경로가 현실적인지 검증하세요.
Track R:R in Your Trading Journal
Add a column for “Planned R:R” and “Actual R:R” in your trading journal. After 30 trades, calculate your average planned R:R vs. actual R:R. If your planned R:R is consistently 1:2 but your actual R:R is 1:0.8 (because you take profits early or move stops), you have identified a specific behavioral problem to fix. This is exactly the kind of insight that makes journaling so powerful.
거래 일지에 “계획 R:R”과 “실제 R:R” 열을 추가하세요. 30건 거래 후 평균 계획 R:R과 실제 R:R을 계산합니다. 계획 R:R이 꾸준히 1:2인데 실제 R:R이 1:0.8이면(수익을 일찍 실현하거나 손절을 옮겨서), 고쳐야 할 구체적인 행동 문제를 식별한 것입니다. 이것이 일지의 힘입니다.
Start Practicing Today
Open Tapbit and pick the BTC/USDT pair. Identify the nearest support and resistance levels. Calculate the R:R before placing any order. If the R:R is below 1:2, do not trade — wait for a better setup. Record every R:R calculation in your journal. After one week, review: how many trades did you skip because R:R was bad? How much money did that save you?
Tapbit에서 BTC/USDT 페어를 선택하세요. 가장 가까운 지지선과 저항선을 식별하세요. 주문 전 R:R을 계산하세요. R:R이 1:2 미만이면 거래하지 말고 더 나은 셋업을 기다리세요. 모든 R:R 계산을 일지에 기록하세요. 1주일 후 검토: R:R이 나빠서 건너뛴 거래가 몇 건인가요? 그것이 얼마나 많은 돈을 절약해 주었나요?
Disclosure: This article contains affiliate links. We may earn a commission at no extra cost to you.
공개: 이 글에는 제휴 링크가 포함되어 있습니다. 추가 비용 없이 커미션을 받을 수 있습니다.