거래량(Volume)은 가격 움직임의 “진짜”와 “가짜”를 구별하는 핵심 도구입니다. 가격이 오르는데 거래량도 함께 증가하면 그 상승은 진짜이고, 가격이 오르는데 거래량이 줄어들면 곧 반전될 가능성이 높습니다. 2026년 1분기 크립토 총 거래량이 20.5조 달러를 기록했으며, 파생상품이 18.6조 달러로 현물(1.9조 달러)을 압도했습니다. 이 글에서는 거래량의 기본 개념, 가격 확인 방법, OBV(On-Balance Volume) 지표 사용법, 그리고 TradingView에서 실전 적용하는 방법까지 초보자 눈높이에서 설명합니다.
Why Volume Is the One Indicator You Should Never Ignore
Price tells you what happened. Volume tells you whether it matters. Every candle on a chart shows a price movement, but without volume, you have no way of knowing if that movement was driven by real market conviction or just a handful of traders pushing the price around.
Think of volume as the crowd behind a price move. If Bitcoin jumps from $69,000 to $72,000 and millions of dollars flowed into the market during that move, the rally has real strength. But if the same price jump happened on thin volume, it is likely a fake-out that will reverse quickly.
In Q1 2026, total crypto trading volume reached $20.5 trillion, with derivatives accounting for $18.6 trillion and spot markets just $1.9 trillion. Understanding how to read volume helps you navigate this massive flow of money and avoid being caught on the wrong side of a trade.
왜 거래량을 절대 무시하면 안 되는가
가격은 “무슨 일이 일어났는지”를 알려주고, 거래량은 “그게 중요한 일인지”를 알려줍니다. 차트의 모든 캔들은 가격 움직임을 보여주지만, 거래량이 없으면 그 움직임이 진짜 시장의 확신에 의한 것인지 아니면 소수의 트레이더가 가격을 움직인 것인지 알 수 없습니다.
거래량을 가격 움직임 뒤에 있는 “군중”이라고 생각하세요. 비트코인이 $69,000에서 $72,000으로 뛰었고 그 과정에서 수백만 달러가 시장에 유입되었다면, 그 상승은 진짜 힘이 있는 것입니다. 하지만 같은 가격 상승이 적은 거래량에서 일어났다면, 곧 되돌려질 가짜 움직임일 가능성이 높습니다.
2026년 1분기 크립토 총 거래량은 20.5조 달러에 달했으며, 파생상품이 18.6조 달러, 현물은 1.9조 달러에 불과했습니다. 거래량을 읽는 법을 이해하면 이 거대한 자금 흐름을 탐색하고 잘못된 쪽에 서는 것을 피할 수 있습니다.
What Exactly Is Trading Volume
Trading volume measures the total number of units of an asset that change hands during a specific time period. On a daily chart, one volume bar represents all the buying and selling that happened during that 24-hour period. On a 1-hour chart, each bar represents one hour of activity.
High volume means many participants are actively trading, which creates stronger and more reliable price movements. Low volume means fewer participants, which creates weaker movements that are easily reversed by a single large order.
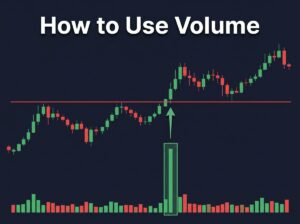
On most charting platforms like TradingView, volume appears as a bar chart at the bottom of the price chart. Green bars indicate that the price closed higher than it opened during that period, while red bars indicate the price closed lower. The taller the bar, the more trading activity occurred.
거래량이란 정확히 무엇인가
거래량은 특정 기간 동안 거래된 자산의 총 수량을 측정합니다. 일봉 차트에서 하나의 거래량 막대는 24시간 동안 발생한 모든 매수·매도를 나타냅니다. 1시간 차트에서는 각 막대가 1시간의 활동을 나타냅니다.
높은 거래량은 많은 참가자가 활발하게 거래하고 있다는 뜻이며, 더 강하고 신뢰할 수 있는 가격 움직임을 만듭니다. 낮은 거래량은 참가자가 적다는 뜻이며, 단일 대형 주문 하나로도 쉽게 뒤집힐 수 있는 약한 움직임을 만듭니다.
TradingView 같은 대부분의 차트 플랫폼에서 거래량은 가격 차트 하단에 막대 차트로 표시됩니다. 초록색 막대는 해당 기간에 시가보다 종가가 높았음을, 빨간색 막대는 종가가 낮았음을 나타냅니다. 막대가 높을수록 더 많은 거래 활동이 있었던 것입니다.
Four Volume Rules Every Beginner Must Know
The relationship between volume and price follows four fundamental rules that apply to every crypto asset.
The first rule is that rising price with rising volume confirms an uptrend. When Bitcoin moves higher and each successive candle has higher volume than the previous one, buyers are in control and the trend is likely to continue. This is the strongest bullish signal volume can give you.
The second rule is that rising price with falling volume signals a weakening trend. If the price keeps climbing but volume is decreasing with each candle, fewer and fewer buyers are supporting the move. This is called a volume divergence, and it often appears before a reversal. During Bitcoin’s run from $63,000 to $73,000 in March 2026, traders who noticed decreasing volume near $72,000 to $73,000 could have anticipated the pullback.
The third rule is that falling price with rising volume confirms a downtrend. When the price drops and volume increases, sellers are aggressively exiting and the decline is likely to continue. This is the most dangerous scenario for anyone holding a long position.
The fourth rule is that falling price with falling volume suggests selling pressure is fading. If volume dries up during a decline, it means sellers are running out of energy. This often precedes a reversal to the upside, especially if the price is near a support level.
초보자가 반드시 알아야 할 4가지 거래량 법칙
거래량과 가격의 관계는 모든 크립토 자산에 적용되는 4가지 기본 법칙을 따릅니다.
첫 번째 법칙: 가격 상승 + 거래량 증가 = 상승 추세 확인. 비트코인이 상승하면서 각 캔들의 거래량이 이전보다 높다면, 매수세가 시장을 장악하고 있으며 추세가 계속될 가능성이 높습니다. 이것이 거래량이 줄 수 있는 가장 강한 강세 신호입니다.
두 번째 법칙: 가격 상승 + 거래량 감소 = 추세 약화 경고. 가격은 계속 오르는데 거래량이 줄어들고 있다면, 점점 적은 수의 매수자만 이 움직임을 지지하고 있다는 뜻입니다. 이를 거래량 다이버전스라 하며, 반전 전에 자주 나타납니다. 2026년 3월 비트코인이 $63,000에서 $73,000으로 올라가는 과정에서 $72,000~$73,000 근처의 거래량 감소를 발견한 트레이더들은 조정을 예상할 수 있었습니다.
세 번째 법칙: 가격 하락 + 거래량 증가 = 하락 추세 확인. 가격이 떨어지면서 거래량이 증가하면, 매도세가 공격적으로 빠져나가고 있으며 하락이 계속될 가능성이 높습니다. 롱 포지션을 보유한 사람에게 가장 위험한 시나리오입니다.
네 번째 법칙: 가격 하락 + 거래량 감소 = 매도 압력 소진. 하락 중에 거래량이 줄어들면 매도세가 에너지를 다 소진했다는 뜻입니다. 특히 가격이 지지선 근처에 있다면 상승 반전이 일어나는 경우가 많습니다.
How to Use Volume to Confirm a Breakout
One of the most common traps beginners fall into is chasing fake breakouts. A price breaks above a resistance level, you buy in excitement, and then the price immediately reverses back below resistance. Volume is the tool that helps you distinguish a real breakout from a fake one.
A real breakout happens when the price moves above resistance with volume that is at least 25 to 30 percent higher than the average volume over the past 20 days. This surge in participation confirms that the market genuinely accepts the new higher price level.
A fake breakout happens when the price crosses resistance on low or average volume. Without strong participation, there is not enough buying pressure to sustain the new price, and the breakout fails.
Here is a practical example. Suppose Bitcoin has been trading between $69,000 and $72,000 for two weeks. The 20-day average volume is $28 billion. If Bitcoin breaks above $72,000 on a day with $38 billion in volume, that is a confirmed breakout with roughly 35 percent above-average volume. But if it breaks out on $25 billion volume, be cautious — the breakout may not hold.
Apply the same logic to breakdowns. If the price falls below a support level on high volume, the breakdown is real and further declines are likely. If the breakdown happens on low volume, the price may quickly recover.
거래량으로 돌파(Breakout)를 확인하는 방법
초보자가 빠지는 가장 흔한 함정 중 하나가 가짜 돌파를 쫓는 것입니다. 가격이 저항선을 돌파하면 흥분해서 매수하는데, 바로 직후 가격이 저항선 아래로 되돌아갑니다. 거래량은 진짜 돌파와 가짜 돌파를 구별하는 도구입니다.
진짜 돌파는 가격이 저항선을 넘으면서 지난 20일 평균 거래량보다 최소 25~30% 높은 거래량을 동반할 때 발생합니다. 이 참여 급증은 시장이 새로운 높은 가격 수준을 진정으로 받아들이고 있다는 확인입니다.
가짜 돌파는 가격이 낮거나 평균적인 거래량으로 저항선을 넘을 때 발생합니다. 강한 참여 없이는 새 가격을 유지할 충분한 매수 압력이 없어 돌파가 실패합니다.
실전 예시입니다. 비트코인이 2주 동안 $69,000~$72,000 사이에서 거래되고 있고, 20일 평균 거래량이 280억 달러라고 가정합시다. 비트코인이 380억 달러의 거래량과 함께 $72,000을 돌파하면, 이는 평균 대비 약 35% 높은 확인된 돌파입니다. 하지만 250억 달러의 거래량으로 돌파했다면, 조심하세요 — 돌파가 유지되지 않을 수 있습니다.
같은 논리를 하방 이탈에도 적용하세요. 높은 거래량으로 지지선 아래로 떨어지면 이탈은 진짜이며 추가 하락이 예상됩니다. 낮은 거래량의 이탈이면 가격이 빠르게 회복될 수 있습니다.
On-Balance Volume — The Volume Indicator That Predicts Moves
On-Balance Volume, or OBV, is a momentum indicator created by Joseph Granville in 1963 that is still one of the most effective volume tools in crypto trading today. OBV works by adding the entire day’s volume when the price closes higher, and subtracting the entire day’s volume when the price closes lower. The result is a running cumulative total that shows whether money is flowing into or out of an asset.
The power of OBV lies in divergences. When the price is making higher highs but OBV is making lower highs, it means buying pressure is fading even though the price is still rising. This bearish divergence often signals a top. Conversely, when the price is making lower lows but OBV is making higher lows, it means selling pressure is fading and an upside reversal is approaching. This bullish divergence is one of the most reliable early warning signals in technical analysis.
For example, if Bitcoin’s price drops from $72,000 to $69,000 over a week but OBV stays flat or rises, it suggests that smart money is actually accumulating during the dip. This divergence often precedes a strong rally.
OBV(On-Balance Volume) — 움직임을 예측하는 거래량 지표
OBV(On-Balance Volume)는 1963년 Joseph Granville이 만든 모멘텀 지표로, 오늘날에도 크립토 트레이딩에서 가장 효과적인 거래량 도구 중 하나입니다. OBV는 가격이 상승 마감하면 그날 전체 거래량을 더하고, 하락 마감하면 전체 거래량을 빼는 방식으로 작동합니다. 결과는 자금이 자산으로 유입되고 있는지 유출되고 있는지를 보여주는 누적 합계입니다.
OBV의 핵심은 다이버전스에 있습니다. 가격이 더 높은 고점을 만들고 있는데 OBV는 더 낮은 고점을 만들고 있다면, 가격은 아직 오르고 있지만 매수 압력이 줄어들고 있다는 뜻입니다. 이 약세 다이버전스는 종종 고점 신호입니다. 반대로, 가격이 더 낮은 저점을 만드는데 OBV가 더 높은 저점을 만들면, 매도 압력이 줄어들고 있으며 상승 반전이 다가오고 있다는 뜻입니다. 이 강세 다이버전스는 기술적 분석에서 가장 신뢰할 수 있는 조기 경고 신호 중 하나입니다.
예를 들어, 비트코인 가격이 일주일 동안 $72,000에서 $69,000으로 하락했는데 OBV가 유지되거나 상승한다면, 스마트 머니가 실제로 하락 중에 매집하고 있다는 것을 시사합니다. 이 다이버전스는 종종 강한 반등의 전조입니다.
Volume Spikes — What They Tell You
A volume spike is a single bar that is dramatically larger than the surrounding bars, often two to three times the average volume. Volume spikes are important because they represent moments of extreme market activity, usually triggered by news events, whale movements, or major support and resistance levels being tested.
When a volume spike occurs at a support level with a bullish candlestick pattern like a hammer or engulfing pattern, it signals strong buying and a likely bounce. When a volume spike occurs at a resistance level with a bearish pattern like a shooting star, it signals strong rejection and a likely reversal downward.
Volume spikes also appear during panic events. When the Iran conflict escalated in late February 2026, Bitcoin’s 24-hour trading volume surged significantly as the price dropped from $73,000 to $63,000. Traders who recognized that the high-volume sell-off was a panic-driven event rather than a fundamental shift could identify the recovery opportunity earlier.
거래량 급등(Volume Spike) — 무엇을 말해주는가
거래량 급등은 주변 막대보다 극적으로 큰 단일 막대로, 보통 평균 거래량의 2~3배 수준입니다. 거래량 급등은 뉴스 이벤트, 고래 움직임, 또는 주요 지지·저항선 테스트로 촉발되는 극단적 시장 활동의 순간을 나타내기 때문에 중요합니다.
지지선에서 해머나 장악형 같은 강세 캔들스틱 패턴과 함께 거래량 급등이 발생하면, 강한 매수와 반등 가능성을 신호합니다. 저항선에서 슈팅스타 같은 약세 패턴과 함께 거래량 급등이 발생하면, 강한 거부와 하방 반전 가능성을 신호합니다.
거래량 급등은 패닉 이벤트 중에도 나타납니다. 2026년 2월 말 이란 분쟁이 격화되었을 때, 비트코인 가격이 $73,000에서 $63,000으로 하락하면서 24시간 거래량이 급증했습니다. 이 고거래량 매도가 근본적 변화가 아닌 패닉 주도 이벤트임을 인식한 트레이더들은 회복 기회를 더 일찍 포착할 수 있었습니다.
How to Add Volume to Your TradingView Chart
Open TradingView and load any crypto chart. Click the “Indicators” button at the top of the screen. Type “Volume” in the search bar and select the basic “Volume” indicator — it will appear as colored bars at the bottom of your chart.
To add OBV, search for “On Balance Volume” in the indicators panel and add it. OBV will appear as a separate line below your chart. Watch for divergences between the OBV line direction and the price direction.
For the best analysis, combine volume with the indicators you already know. Check the RSI to see if the asset is overbought or oversold. Look at the moving averages to determine the overall trend direction. Then use volume to confirm whether the signals from those indicators are backed by real market participation. Use the MACD crossover in combination with a volume surge for even stronger confirmation.
TradingView에 거래량 추가하는 방법
TradingView를 열고 아무 크립토 차트를 로드하세요. 화면 상단의 “Indicators” 버튼을 클릭합니다. 검색창에 “Volume”을 입력하고 기본 “Volume” 지표를 선택하면 차트 하단에 색상 막대로 나타납니다.
OBV를 추가하려면 지표 패널에서 “On Balance Volume”을 검색하고 추가하세요. OBV는 차트 아래 별도의 선으로 나타납니다. OBV 선의 방향과 가격 방향 사이의 다이버전스를 주시하세요.
최고의 분석을 위해 이미 알고 있는 지표들과 거래량을 결합하세요. RSI로 과매수·과매도 여부를 확인하고, 이동평균선으로 전체 추세 방향을 판단한 뒤, 거래량으로 그 지표들의 신호가 실제 시장 참여로 뒷받침되는지 확인하세요. MACD 크로스오버와 거래량 급등을 결합하면 더욱 강력한 확인이 됩니다.
Common Volume Mistakes Beginners Make
The first mistake is ignoring volume entirely. Many beginners focus only on price and candlestick patterns without ever looking at the volume bars below. This leads to falling for fake breakouts and weak trend signals.
The second mistake is treating all volume equally. Volume on a 5-minute chart has completely different significance than volume on a daily chart. Always match your volume analysis to the time frame of your trading strategy.
The third mistake is confusing exchange volume with total market volume. A single exchange may show low volume for a particular coin while the overall market volume across all exchanges is high. Use aggregated volume data from CoinMarketCap or CoinGecko for the most accurate picture.
초보자가 흔히 하는 거래량 실수
첫 번째 실수는 거래량을 완전히 무시하는 것입니다. 많은 초보자들이 가격과 캔들스틱 패턴에만 집중하고 아래의 거래량 막대를 전혀 보지 않습니다. 이로 인해 가짜 돌파와 약한 추세 신호에 속게 됩니다.
두 번째 실수는 모든 거래량을 동일하게 취급하는 것입니다. 5분 차트의 거래량은 일봉 차트의 거래량과 완전히 다른 의미를 갖습니다. 항상 거래량 분석을 자신의 트레이딩 전략 시간대에 맞추세요.
세 번째 실수는 거래소 거래량과 전체 시장 거래량을 혼동하는 것입니다. 단일 거래소에서는 특정 코인의 거래량이 낮게 보일 수 있지만, 모든 거래소를 합산한 전체 시장 거래량은 높을 수 있습니다. 가장 정확한 그림을 위해 CoinMarketCap이나 CoinGecko의 집계 거래량 데이터를 사용하세요.
Start Practicing Volume Analysis Today
Volume is not complicated once you understand the four basic rules. Rising price plus rising volume equals real move. Rising price plus falling volume equals warning sign. Every chart you look at from today forward should include volume at the bottom.
Practice reading volume on Tapbit, which offers real-time charting tools with volume data for all major trading pairs. Start with the BTC/USDT pair and observe how volume changes at key support and resistance levels. Set realistic profit targets and always use a stop-loss.
오늘부터 거래량 분석 연습을 시작하세요
4가지 기본 법칙을 이해하면 거래량은 복잡하지 않습니다. 가격 상승 + 거래량 증가 = 진짜 움직임. 가격 상승 + 거래량 감소 = 경고 신호. 오늘부터 보는 모든 차트 하단에 거래량을 포함시키세요.
Tapbit에서 거래량 읽기를 연습하세요. 모든 주요 거래 쌍에 대한 실시간 차트 도구와 거래량 데이터를 제공합니다. BTC/USDT 쌍으로 시작해서 주요 지지·저항 수준에서 거래량이 어떻게 변하는지 관찰하세요. 현실적인 수익 목표를 설정하고 항상 손절을 사용하세요.
Disclosure: This article contains affiliate links. We may earn a commission at no extra cost to you.