Introduction
If you have spent any time looking at crypto charts, you have probably seen traders drawing horizontal lines at strange percentages — 23.6%, 38.2%, 50%, 61.8%, 78.6%. These are Fibonacci retracement levels, and they are one of the most widely used tools in technical analysis. The idea is simple: after a big price move, the market tends to pull back to predictable levels before continuing. Fibonacci retracement helps you identify those levels so you can plan better entries, exits, and stop-losses.
암호화폐 차트를 조금이라도 본 적이 있다면, 트레이더들이 23.6%, 38.2%, 50%, 61.8%, 78.6% 같은 이상한 비율에 수평선을 그리는 것을 본 적이 있을 겁니다. 이것이 피보나치 되돌림(Fibonacci Retracement) 레벨이며, 기술적 분석에서 가장 널리 사용되는 도구 중 하나입니다. 원리는 간단합니다: 큰 가격 움직임 이후 시장은 예측 가능한 수준까지 되돌린 다음 추세를 이어가는 경향이 있습니다. 피보나치 되돌림은 그 수준을 식별해 더 나은 진입, 청산, 손절 계획을 세울 수 있게 도와줍니다.
Where Do Fibonacci Numbers Come From?
The Fibonacci sequence was introduced by the Italian mathematician Leonardo of Pisa in the 13th century. The sequence starts with 0 and 1, and each subsequent number is the sum of the two before it: 0, 1, 1, 2, 3, 5, 8, 13, 21, 34, 55, 89, 144, and so on.
피보나치 수열은 13세기 이탈리아 수학자 레오나르도 디 피사가 소개했습니다. 0과 1에서 시작하여 각 숫자가 앞의 두 숫자의 합인 수열입니다: 0, 1, 1, 2, 3, 5, 8, 13, 21, 34, 55, 89, 144…
The key ratios come from dividing numbers in the sequence. Divide any number by the one after it and you get approximately 0.618 — this is the Golden Ratio. Divide by the number two places ahead and you get 0.382. Divide by the number three places ahead and you get 0.236. These ratios — 23.6%, 38.2%, 50%, 61.8%, and 78.6% — form the core Fibonacci retracement levels that traders use on charts.
핵심 비율은 수열의 숫자를 나누어 구합니다. 임의의 숫자를 바로 다음 숫자로 나누면 약 0.618이 되는데, 이것이 **황금비(Golden Ratio)**입니다. 두 자리 뒤 숫자로 나누면 0.382, 세 자리 뒤로 나누면 0.236이 됩니다. 이 비율들 — 23.6%, 38.2%, 50%, 61.8%, 78.6% — 이 트레이더가 차트에서 사용하는 핵심 피보나치 되돌림 레벨입니다.
The 50% level is not technically a Fibonacci ratio, but traders include it because markets frequently retrace to the midpoint of a move.
50% 레벨은 엄밀히 말해 피보나치 비율은 아니지만, 시장이 움직임의 중간 지점까지 되돌리는 경우가 많아 트레이더들이 포함시킵니다.
How Fibonacci Retracement Works in Crypto
The tool works by connecting two extreme price points — a significant swing low (the bottom of a move) and a swing high (the top of a move). The software then draws horizontal lines at the key Fibonacci percentages between those two points. These lines represent potential support or resistance zones where the price may pause, bounce, or reverse.
피보나치 되돌림은 두 극단 가격 — 의미 있는 **스윙 로우(저점)**와 스윙 하이(고점) — 를 연결하여 작동합니다. 소프트웨어가 두 지점 사이의 핵심 피보나치 비율에 수평선을 자동으로 그립니다. 이 선들은 가격이 멈추거나, 반등하거나, 반전할 수 있는 잠재적 지지 또는 저항 구간을 나타냅니다.
In an uptrend, you draw the tool from the swing low to the swing high. The retracement levels below the high become potential support zones where you might look to buy on a pullback. In a downtrend, you draw from the swing high to the swing low. The retracement levels above the low become potential resistance zones where the price may stall during a bounce.
상승 추세에서는 스윙 로우에서 스윙 하이로 도구를 그립니다. 고점 아래의 되돌림 레벨이 눌림 매수를 고려할 수 있는 잠재적 지지 구간이 됩니다. 하락 추세에서는 스윙 하이에서 스윙 로우로 그립니다. 저점 위의 되돌림 레벨이 반등 시 가격이 정체될 수 있는 잠재적 저항 구간이 됩니다.
Real Example: Bitcoin October 2025 – April 2026
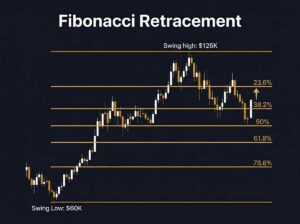
Let us apply Fibonacci retracement to the most significant Bitcoin move in recent history. Bitcoin hit an all-time high of approximately $126,000 on October 6, 2025. Then the market collapsed — $19 billion in leveraged positions were liquidated in a single event on October 10, 2025 — and Bitcoin fell roughly 50% to about $60,000 by early February 2026.
최근 가장 중요한 비트코인 움직임에 피보나치 되돌림을 적용해 봅시다. 비트코인은 2025년 10월 6일 약 $126,000에서 사상 최고가를 기록했습니다. 이후 시장이 붕괴하여 — 10월 10일 하루 만에 $190억의 레버리지 포지션이 청산 — 비트코인은 2026년 2월 초 약 $60,000까지 약 50% 하락했습니다.
Drawing Fibonacci from the $60,000 low to the $126,000 high gives us these retracement levels for the recovery rally:
$60,000 저점에서 $126,000 고점까지 피보나치를 그리면, 회복 랠리에 대한 되돌림 레벨은 다음과 같습니다:
- 23.6% retracement: $75,576 — Bitcoin bounced through this level in mid-March 2026 and is currently trading near it at approximately $74,000, making it an active battleground.
- 38.2% retracement: $85,212 — This would be the next target if bulls push above $76,000 convincingly.
- 50% retracement: $93,000 — The psychological midpoint of the entire crash.
- 61.8% retracement (Golden Ratio): $100,788 — The most important Fibonacci level. A reclaim here would signal that the bull market is likely resuming.
- 78.6% retracement: $111,876 — Near the previous cycle top zone.
- 23.6% 되돌림: $75,576 — 비트코인이 2026년 3월 중순 이 레벨을 돌파했으며, 현재 약 $74,000에서 거래 중이므로 활발한 공방 구간입니다.
- 38.2% 되돌림: $85,212 — 강세장이 $76,000을 확실히 돌파하면 다음 목표가 됩니다.
- 50% 되돌림: $93,000 — 전체 하락폭의 심리적 중간 지점입니다.
- 61.8% 되돌림 (황금비): $100,788 — 가장 중요한 피보나치 레벨. 이 수준을 회복하면 상승장 재개 신호입니다.
- 78.6% 되돌림: $111,876 — 이전 사이클 고점 영역에 근접합니다.
Right now, Bitcoin at ~$74,000 is testing the area just below the 23.6% level. If it breaks above $75,576 with strong volume, the next Fibonacci target is $85,212 (38.2%). If it fails and drops, the February low of $60,000 becomes the key support to watch.
현재 비트코인은 약 $74,000으로 23.6% 레벨 바로 아래를 테스트하고 있습니다. 강한 거래량과 함께 $75,576을 돌파하면 다음 피보나치 목표는 $85,212(38.2%)입니다. 실패하고 하락하면 2월 저점 $60,000이 핵심 지지선이 됩니다.
The Golden Zone: 50% – 61.8%
Professional traders pay the most attention to the 50% – 61.8% zone, often called the “Golden Zone.” This is where the highest probability reversals tend to occur. When the price retraces into this zone and shows signs of support — such as a bullish candlestick pattern, RSI below 35, or a volume spike — it is considered a strong buying opportunity in an uptrend.
전문 트레이더들은 50% – 61.8% 구간에 가장 주목하며, 이를 “골든 존(Golden Zone)”이라고 부릅니다. 가장 높은 확률로 반전이 일어나는 구간입니다. 가격이 이 구간까지 되돌리고 지지 신호 — 강세 캔들스틱 패턴, RSI 35 미만, 거래량 급증 등 — 를 보이면 상승 추세에서 강력한 매수 기회로 간주됩니다.
In the Bitcoin example above, the Golden Zone sits between $93,000 and $100,788. If Bitcoin rallies from its current level and eventually pulls back into that zone during a future correction, Fibonacci traders would watch closely for buy signals there.
위 비트코인 예시에서 골든 존은 $93,000~$100,788 사이에 위치합니다. 비트코인이 현재 수준에서 랠리한 후 미래 조정에서 해당 구간까지 되돌리면, 피보나치 트레이더들은 그곳에서 매수 신호를 주의 깊게 관찰할 것입니다.
A Reddit backtest study from December 2025 tested the 61.8% retracement strategy across 100 US stocks and 100 crypto pairs. The results showed that the 61.8% level acted as meaningful support or resistance significantly more often than random chance would predict — though it is far from perfect. No single tool works 100% of the time, which is why Fibonacci should always be combined with other indicators.
2025년 12월 Reddit 백테스트 연구에서 61.8% 되돌림 전략을 미국 주식 100개와 암호화폐 페어 100개에 테스트한 결과, 61.8% 레벨이 무작위 확률보다 훨씬 높은 빈도로 의미 있는 지지 또는 저항 역할을 했습니다. 다만 완벽하지는 않으므로, 피보나치는 항상 다른 지표와 결합해서 사용해야 합니다.
How to Draw Fibonacci Retracement on TradingView
Setting up Fibonacci retracement on TradingView takes less than a minute. Click the “Fib Retracement” tool in the left toolbar (it looks like a small triangle with horizontal lines). For an uptrend, click on the swing low first, then drag to the swing high. For a downtrend, click the swing high first, then drag to the swing low. TradingView will automatically draw lines at 23.6%, 38.2%, 50%, 61.8%, and 78.6%.
TradingView에서 피보나치 되돌림을 설정하는 데 1분도 걸리지 않습니다. 왼쪽 도구 모음에서 “Fib Retracement” 도구를 클릭하세요 (수평선이 있는 작은 삼각형 모양). 상승 추세에서는 스윙 로우를 먼저 클릭한 뒤 스윙 하이로 드래그합니다. 하락 추세에서는 스윙 하이를 먼저 클릭한 뒤 스윙 로우로 드래그합니다. TradingView가 23.6%, 38.2%, 50%, 61.8%, 78.6%에 자동으로 선을 그려줍니다.
Make sure you are using a meaningful time frame. For swing trading, use the daily or 4-hour chart. For long-term analysis, use the weekly chart. Avoid using Fibonacci on the 1-minute or 5-minute chart — the noise is too high and the levels become unreliable.
의미 있는 시간 프레임을 사용하세요. 스윙 트레이딩에는 일간 또는 4시간 차트를, 장기 분석에는 주간 차트를 사용합니다. 1분 또는 5분 차트에서 피보나치를 사용하지 마세요 — 노이즈가 너무 많아 레벨이 신뢰할 수 없게 됩니다.
Combining Fibonacci with Other Tools
Fibonacci retracement is most powerful when it confluences — when a Fibonacci level lines up with another indicator or signal. The more tools that agree on the same price level, the stronger that level becomes.
피보나치 되돌림은 컨플루언스(합류) — 피보나치 레벨이 다른 지표나 신호와 일치할 때 — 가장 강력합니다. 같은 가격대에 동의하는 도구가 많을수록 해당 레벨이 더 강해집니다.
Here are the best combinations. First, Fibonacci level aligns with a support or resistance zone — if the 38.2% level ($85,212 for BTC) also matches a previous support level visible on the chart, the probability of a reaction there increases significantly. Second, Fibonacci level aligns with a moving average — if the 50% retracement sits near the 200-day SMA, it becomes a very strong zone. Third, RSI confirms the level — if the price reaches the 61.8% level and RSI drops below 30 (oversold), the bounce signal is much more reliable. Fourth, volume spikes at the level — a surge in buying volume exactly at a Fibonacci support level confirms that real buyers are stepping in. Fifth, Bollinger Bands touch — if the price hits the lower Bollinger Band at the same time as a Fibonacci support level, the confluence is very strong.
최적의 조합은 다음과 같습니다. 첫째, 피보나치 레벨이 지지·저항 구간과 일치 — BTC 38.2% 레벨($85,212)이 차트상 이전 지지선과 겹치면 반응 확률이 크게 높아집니다. 둘째, 피보나치 레벨이 이동평균과 일치 — 50% 되돌림이 200일 SMA 근처에 있으면 매우 강한 구간이 됩니다. 셋째, RSI가 레벨을 확인 — 가격이 61.8%에 도달하고 RSI가 30 아래(과매도)이면 반등 신호가 훨씬 신뢰할 만합니다. 넷째, 해당 레벨에서 거래량 급증 — 피보나치 지지선에서 매수 거래량이 급증하면 실제 매수자가 진입하고 있음을 확인해 줍니다. 다섯째, 볼린저 밴드 터치 — 피보나치 지지선에서 동시에 하단 볼린저 밴드에 닿으면 컨플루언스가 매우 강합니다.
Common Mistakes Beginners Make with Fibonacci
Mistake 1: Choosing the wrong swing points. If you pick a minor dip instead of the true swing low, all your levels will be off. Use the most obvious, significant highs and lows on the daily or weekly chart — points that every trader can see.
실수 1: 잘못된 스윙 포인트 선택. 진정한 스윙 로우 대신 작은 하락을 선택하면 모든 레벨이 틀어집니다. 일간 또는 주간 차트에서 모든 트레이더가 볼 수 있는 가장 명확하고 중요한 고점과 저점을 사용하세요.
Mistake 2: Using Fibonacci alone. Fibonacci levels are zones of interest, not guaranteed reversal points. A price can blow right through a 61.8% level if there is no confluence. Always combine with RSI, volume, moving averages, or MACD.
실수 2: 피보나치만 단독 사용. 피보나치 레벨은 관심 구간이지 보장된 반전 지점이 아닙니다. 컨플루언스가 없으면 가격이 61.8%를 그냥 뚫고 지나갈 수 있습니다. 항상 RSI, 거래량, 이동평균, MACD와 결합하세요.
Mistake 3: Ignoring the trend. Fibonacci retracement works best in a clear trend. In a choppy, sideways market, the levels become less meaningful. If Bitcoin is ranging between $72,000 and $76,000 with no clear direction, Fibonacci retracement will not give you reliable signals.
실수 3: 추세 무시. 피보나치 되돌림은 명확한 추세에서 가장 잘 작동합니다. 횡보하는 시장에서는 레벨의 의미가 줄어듭니다. 비트코인이 $72,000~$76,000 사이에서 방향 없이 횡보 중이라면 피보나치가 신뢰할 만한 신호를 주지 않습니다.
Mistake 4: Treating levels as exact prices. Fibonacci levels are zones, not precise lines. The price might bounce at $85,000 instead of exactly $85,212. Give yourself a buffer of 1-2% around each level.
실수 4: 레벨을 정확한 가격으로 취급. 피보나치 레벨은 정밀한 선이 아닌 구간입니다. 가격이 정확히 $85,212가 아니라 $85,000에서 반등할 수 있습니다. 각 레벨 주변에 1-2%의 여유를 두세요.
Mistake 5: Entering without a stop-loss. Even if the Fibonacci level holds, you need a plan for when it does not. Place your stop-loss below the next Fibonacci level. For example, if you buy at the 38.2% level, set your stop-loss just below the 50% level. This way your risk is defined before you enter the trade. Follow the 1-2% risk rule at all times.
실수 5: 손절 없이 진입. 피보나치 레벨이 유지되더라도, 유지되지 않을 때의 계획이 필요합니다. 다음 피보나치 레벨 아래에 손절을 설정하세요. 예: 38.2%에서 매수하면 50% 레벨 바로 아래에 손절 설정. 거래 전에 위험이 정의됩니다. 항상 1-2% 리스크 규칙을 따르세요.
Fibonacci Retracement Checklist for Beginners
Before entering a trade using Fibonacci, ask yourself these five questions. Is the trend clear (up or down)? Did I use the correct swing high and swing low on the daily or weekly chart? Does the Fibonacci level align with at least one other indicator (RSI, volume, MA, support/resistance)? Have I set a stop-loss below the next Fibonacci level? Does the risk-reward ratio make sense — at least 1:2? If any answer is “no,” do not take the trade.
피보나치를 사용해 거래하기 전에 다음 5가지 질문을 스스로에게 하세요. 추세가 명확한가(상승 또는 하락)? 일간 또는 주간 차트에서 올바른 스윙 하이와 스윙 로우를 사용했는가? 피보나치 레벨이 최소 하나의 다른 지표(RSI, 거래량, MA, 지지·저항)와 일치하는가? 다음 피보나치 레벨 아래에 손절을 설정했는가? 위험 대비 보상 비율이 최소 1:2인가? 하나라도 “아니오”이면 거래하지 마세요.
Start Practicing Today
Open a chart on Tapbit or TradingView. Find the most recent significant swing low and swing high on BTC/USDT. Draw the Fibonacci retracement tool and identify the key levels. Then watch how the price reacts around those levels over the next few days. The more you practice, the faster you will develop an eye for high-probability setups.
Tapbit 또는 TradingView에서 차트를 열어보세요. BTC/USDT에서 가장 최근의 중요한 스윙 로우와 스윙 하이를 찾으세요. 피보나치 되돌림 도구를 그리고 핵심 레벨을 확인하세요. 그런 다음 며칠간 가격이 해당 레벨 주변에서 어떻게 반응하는지 관찰하세요. 연습할수록 높은 확률의 셋업을 빠르게 읽는 눈이 생깁니다.
Disclosure: This article contains affiliate links. We may earn a commission at no extra cost to you.
공개: 이 글에는 제휴 링크가 포함되어 있습니다. 추가 비용 없이 커미션을 받을 수 있습니다.