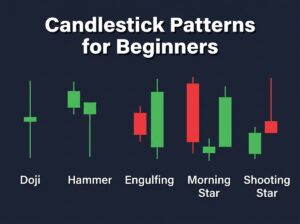
캔들스틱은 특정 시간 동안의 시가·종가·고가·저가를 하나의 막대로 표현한 것입니다. 양봉(초록)은 가격 상승, 음봉(빨강)은 가격 하락을 의미합니다. 초보자가 반드시 알아야 할 패턴 5가지 — 도지(Doji), 해머(Hammer), 장악형(Engulfing), 모닝스타(Morning Star), 슈팅스타(Shooting Star)를 다루며, 캔들 하나만 보고 판단하지 말고 이동평균선·RSI와 함께 사용해야 정확도가 높아집니다.
The crypto market moves fast, and raw price numbers can be hard to follow. Candlestick patterns give you a visual way to understand what happened during any time period — who was winning between buyers and sellers, and what might happen next.
암호화폐 시장은 빠르게 움직이며, 원시 가격 숫자만으로는 따라가기 어렵습니다. 캔들스틱 패턴은 특정 시간 동안 매수자와 매도자 중 누가 이기고 있었는지, 그리고 다음에 무슨 일이 일어날 수 있는지를 시각적으로 이해할 수 있게 해줍니다.
How a Single Candlestick Works
Every candlestick tells you four pieces of information — the open price, the close price, the highest price, and the lowest price within a specific time frame. If you are looking at a 1-day chart, each candle represents one full day of trading.
모든 캔들스틱은 특정 시간 내의 시가, 종가, 고가, 저가 네 가지 정보를 알려줍니다. 1일 차트를 보고 있다면 각 캔들은 하루 전체의 거래를 나타냅니다.
The thick part of the candle is called the body. If the closing price is higher than the opening price, the candle is green, which means buyers pushed the price up during that period. If the closing price is lower than the opening price, the candle is red, meaning sellers were in control.
캔들의 두꺼운 부분을 몸통(body)이라고 합니다. 종가가 시가보다 높으면 초록색 캔들로 해당 기간에 매수자가 가격을 올렸다는 뜻입니다. 종가가 시가보다 낮으면 빨간색 캔들로 매도자가 주도했다는 의미입니다.
The thin lines above and below the body are called wicks or shadows. The upper wick shows the highest price reached before sellers pushed it back down. The lower wick shows the lowest price reached before buyers stepped in and pushed it back up. Long wicks tell you there was a strong fight between buyers and sellers at that level.
몸통 위아래의 가는 선을 꼬리(wick) 또는 그림자(shadow)라고 합니다. 윗꼬리는 매도자가 밀어내리기 전 도달한 최고가를, 아랫꼬리는 매수자가 개입하여 밀어올리기 전 도달한 최저가를 보여줍니다. 긴 꼬리는 해당 가격대에서 매수자와 매도자 간의 강한 싸움이 있었음을 의미합니다.
Five Candlestick Patterns Every Beginner Must Know
You do not need to memorize hundreds of patterns. These five patterns appear frequently on Bitcoin and altcoin charts and give you reliable signals when combined with other tools.
수백 가지 패턴을 외울 필요는 없습니다. 이 다섯 가지 패턴은 비트코인과 알트코인 차트에 자주 나타나며, 다른 도구와 결합하면 신뢰할 수 있는 신호를 제공합니다.
Doji — The Market Is Undecided
A Doji candle has almost no body, meaning the open and close prices are nearly identical. The wicks can be long or short. This pattern signals that neither buyers nor sellers won during that period — the market is undecided. A Doji after a long uptrend can mean the buying momentum is fading. A Doji after a long downtrend can mean sellers are losing steam. It does not tell you the direction, but it warns you that a change may be coming.
도지 캔들은 몸통이 거의 없어서 시가와 종가가 거의 같습니다. 이 패턴은 매수자도 매도자도 해당 기간에 승리하지 못했음을 — 시장이 결정을 못 내리고 있음을 신호합니다. 장기 상승 추세 후 도지는 매수 모멘텀이 약해지고 있다는 뜻일 수 있고, 장기 하락 추세 후 도지는 매도세가 힘을 잃고 있다는 뜻일 수 있습니다.
Hammer — Buyers Are Fighting Back
A Hammer has a small body at the top and a long lower wick, at least twice the length of the body. It appears at the bottom of a downtrend. The long lower wick means the price dropped significantly during the period, but buyers came in hard and pushed the price back up near the open. This is a bullish reversal signal — it suggests the sell-off may be ending and buyers are taking control.
해머는 상단에 작은 몸통과 몸통 길이의 최소 두 배인 긴 아랫꼬리를 가집니다. 하락 추세의 바닥에서 나타납니다. 긴 아랫꼬리는 해당 기간에 가격이 크게 떨어졌지만 매수자가 강하게 개입하여 시가 부근까지 다시 밀어올렸다는 뜻입니다. 이것은 강세 반전 신호로 — 매도세가 끝나가고 매수자가 주도권을 잡고 있음을 시사합니다.
Engulfing Pattern — A Clear Shift in Power
A Bullish Engulfing pattern is a two-candle pattern. The first candle is red and relatively small. The second candle is green and its body completely covers the first candle’s body. This means buyers overwhelmed the previous day’s sellers with even more force. It is a strong signal that momentum is shifting from bearish to bullish, especially when it appears near a support level.
강세 장악형은 두 개의 캔들로 구성됩니다. 첫 번째 캔들은 비교적 작은 음봉이고, 두 번째 캔들은 양봉으로 몸통이 첫 번째 캔들의 몸통을 완전히 덮습니다. 이는 매수자가 전날의 매도세를 더 강한 힘으로 압도했다는 뜻입니다. 특히 지지선 부근에서 나타나면 약세에서 강세로 모멘텀이 전환되고 있다는 강한 신호입니다.
A Bearish Engulfing is the reverse — a small green candle followed by a large red candle that swallows it. This appears near resistance levels and warns that sellers have taken over.
약세 장악형은 반대입니다 — 작은 양봉 뒤에 그것을 삼키는 큰 음봉이 오는 것입니다. 저항선 부근에서 나타나며 매도자가 주도권을 잡았다는 경고입니다.
Morning Star — Dawn After Darkness
The Morning Star is a three-candle reversal pattern that appears at the bottom of a downtrend. The first candle is a large red candle showing strong selling. The second candle is a small-bodied candle, either red or green, showing the selling pressure is weakening. The third candle is a large green candle that closes well above the midpoint of the first candle, confirming that buyers have taken over. This pattern is one of the most reliable bullish reversal signals in technical analysis.
모닝스타는 하락 추세의 바닥에서 나타나는 세 개의 캔들 반전 패턴입니다. 첫 번째는 강한 매도를 보여주는 큰 음봉, 두 번째는 매도 압력이 약해지고 있음을 보여주는 작은 몸통의 캔들, 세 번째는 첫 번째 캔들 중간점 위로 마감하는 큰 양봉으로 매수자가 주도권을 잡았음을 확인합니다. 기술적 분석에서 가장 신뢰할 수 있는 강세 반전 신호 중 하나입니다.
Shooting Star — A Warning at the Top
A Shooting Star has a small body at the bottom and a long upper wick. It appears at the top of an uptrend. The long upper wick means the price shot up during the period, but sellers pushed it all the way back down before the close. This is a bearish reversal signal — buyers tried to push higher but failed, and the uptrend may be losing momentum.
슈팅스타는 하단에 작은 몸통과 긴 윗꼬리를 가집니다. 상승 추세의 꼭대기에서 나타납니다. 긴 윗꼬리는 해당 기간에 가격이 급등했지만 매도자가 종가 전에 다시 끌어내렸다는 뜻입니다. 이것은 약세 반전 신호로 — 매수자가 더 높이 밀어올리려 했지만 실패했고, 상승 추세가 모멘텀을 잃고 있을 수 있습니다.
How to Use Candlestick Patterns the Right Way
The biggest mistake beginners make is treating a single candlestick pattern as a guaranteed buy or sell signal. A Hammer at the bottom of a downtrend looks promising, but it is far more powerful when it appears right at a known support level while RSI is below 30. Similarly, a Shooting Star near resistance is more meaningful when the moving average is also showing weakening momentum.
초보자들이 가장 많이 하는 실수는 단일 캔들스틱 패턴을 확실한 매수·매도 신호로 취급하는 것입니다. 하락 추세 바닥의 해머는 유망해 보이지만, 알려진 지지선에서 RSI가 30 이하일 때 나타나면 훨씬 더 강력합니다. 마찬가지로 저항선 부근의 슈팅스타는 이동평균선도 모멘텀 약화를 보여줄 때 더 의미 있습니다.
Always wait for confirmation. If you see a Bullish Engulfing pattern, wait for the next candle to close green before entering. Confirmation reduces the chance of falling for a false signal.
항상 확인을 기다리세요. 강세 장악형 패턴을 봤다면, 진입하기 전에 다음 캔들이 양봉으로 마감하는 것을 기다리세요. 확인은 거짓 신호에 빠질 확률을 줄여줍니다.
If you want to practice spotting these patterns in real time, Tapbit offers clean charting tools that make it easy to zoom into candlestick details on any trading pair.
이 패턴들을 실시간으로 찾는 연습을 하고 싶다면, Tapbit이 어떤 거래 페어에서든 캔들스틱 세부 사항을 쉽게 확대할 수 있는 깔끔한 차트 도구를 제공합니다.
Ready to start your crypto journey? Sign up for Tapbit and begin trading today.
Disclosure: This article contains affiliate links. We may earn a small commission at no extra cost to you.