Every time you place a trade on a crypto exchange, your order enters a live queue called the order book. Most beginners ignore it entirely — they just click “Buy” and hope for the best. But the order book is one of the most powerful free tools available to any trader. It shows you exactly where buyers and sellers are waiting, how much liquidity exists at each price level, and whether the market is about to move. Learning to read it takes 10 minutes. Using it well can save you hundreds of dollars in bad entries.
암호화폐 거래소에서 주문을 넣을 때마다, 그 주문은 **오더북(호가창)**이라는 실시간 대기열에 들어갑니다. 대부분의 초보자는 오더북을 완전히 무시하고 “매수” 버튼만 누릅니다. 하지만 오더북은 모든 트레이더가 무료로 사용할 수 있는 가장 강력한 도구 중 하나입니다. 매수자와 매도자가 어디에서 대기 중인지, 각 가격대에 유동성이 얼마나 있는지, 시장이 곧 움직일지를 정확히 보여줍니다. 읽는 법을 배우는 데 10분이면 충분하고, 잘 활용하면 잘못된 진입으로 인한 수백 달러의 손실을 막을 수 있습니다.
What Is an Order Book?
An order book is a real-time list of all open buy and sell orders for a specific trading pair — for example, BTC/USDT. It is maintained by the exchange and updates constantly as traders place, modify, and cancel orders. Every centralized exchange — Binance, Coinbase, Tapbit, Kraken — runs its own order book for each pair.
오더북은 특정 거래쌍(예: BTC/USDT)에 대한 모든 미체결 매수·매도 주문을 실시간으로 보여주는 목록입니다. 거래소가 관리하며, 트레이더가 주문을 넣거나 수정·취소할 때마다 끊임없이 업데이트됩니다. Binance, Coinbase, Tapbit, Kraken 등 모든 중앙화 거래소는 각 거래쌍마다 자체 오더북을 운영합니다.
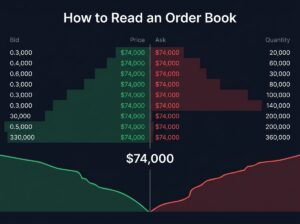
The book has two sides. The bid side (usually shown in green) lists all current buy orders arranged from the highest price down. These are traders willing to pay a certain price or less. The ask side (usually shown in red) lists all current sell orders arranged from the lowest price up. These are traders willing to sell at a certain price or more.
오더북은 두 면으로 나뉩니다. 매수(Bid) 측(보통 녹색)은 현재 모든 매수 주문을 최고가부터 낮은 순으로 나열합니다. 매도(Ask) 측(보통 빨간색)은 현재 모든 매도 주문을 최저가부터 높은 순으로 나열합니다.
The best bid is the highest price any buyer is currently willing to pay. The best ask is the lowest price any seller is currently willing to accept. The difference between these two numbers is called the spread.
**최고 매수가(best bid)**는 매수자가 현재 지불할 의사가 있는 가장 높은 가격이고, **최저 매도가(best ask)**는 매도자가 수락할 의사가 있는 가장 낮은 가격입니다. 이 두 가격의 차이를 스프레드라고 합니다.
Understanding the Spread
The spread tells you how liquid a market is. A tight spread — for example, $74,000.00 bid and $74,000.50 ask (a $0.50 spread on BTC) — means there are plenty of buyers and sellers competing close to the same price. A wide spread — such as $74,000 bid and $74,050 ask (a $50 spread) — usually means thin liquidity, and you will pay more to enter or exit a position.
스프레드는 시장의 유동성을 알려줍니다. 좁은 스프레드 — 예: 매수 $74,000.00, 매도 $74,000.50 (BTC 기준 $0.50 차이) — 는 매수자와 매도자가 비슷한 가격에서 활발히 경쟁하고 있다는 뜻입니다. 넓은 스프레드 — 예: 매수 $74,000, 매도 $74,050 ($50 차이) — 는 유동성이 부족하다는 뜻이며, 진입·청산 시 더 많은 비용을 지불하게 됩니다.
For major pairs like BTC/USDT on large exchanges, spreads are usually less than $1. For small altcoins on smaller exchanges, spreads can be 1-3% of the price — which means you lose money the instant you buy.
BTC/USDT 같은 주요 거래쌍은 대형 거래소에서 스프레드가 보통 $1 미만입니다. 소형 알트코인은 스프레드가 가격의 1-3%에 달할 수 있는데, 이는 매수하는 순간 이미 손해를 보고 시작한다는 뜻입니다.
Rule for beginners: If the spread is wider than 0.5% of the price, think twice before trading that pair. You are starting the trade at a disadvantage.
초보자 규칙: 스프레드가 가격의 0.5%를 초과하면 해당 거래쌍 거래를 다시 생각하세요. 시작부터 불리한 위치에서 거래하는 것입니다.
Reading Market Depth
Below the best bid and best ask, you will see rows of orders at progressively lower (bid side) and higher (ask side) prices. This is called market depth. It shows how much buying or selling pressure exists at each price level.
최고 매수가와 최저 매도가 아래로 점점 낮은(매수 측) 또는 높은(매도 측) 가격대에 주문 행이 나열됩니다. 이를 **시장 깊이(Market Depth)**라고 하며, 각 가격대에 얼마나 많은 매수·매도 압력이 있는지 보여줍니다.
For example, if the bid side shows: $74,000 with 2.5 BTC, $73,950 with 8.3 BTC, and $73,900 with 15.1 BTC — this means there are 2.5 BTC worth of buy orders at $74,000, another 8.3 BTC at $73,950, and so on. If a large sell order comes in, it will chew through these levels one by one. The thicker the bids, the harder it is for the price to drop.
예를 들어 매수 측이 $74,000에 2.5 BTC, $73,950에 8.3 BTC, $73,900에 15.1 BTC를 보여준다면, $74,000에서 2.5 BTC 규모의 매수 주문이 대기 중이라는 뜻입니다. 대량 매도 주문이 들어오면 이 수준을 하나씩 소화합니다. 매수 주문이 두꺼울수록 가격이 하락하기 어렵습니다.
Recent data shows why depth matters more than ever. According to a Cointelegraph report from April 11, 2026, Bitcoin order book depth — the volume of orders within 1% of the current price — has fallen roughly 50% since September 2025. It used to sit between $180 million and $260 million; now it rarely exceeds $130 million. In February 2026, it even dipped below $60 million for about 10 days. Thinner order books mean prices can swing more violently on smaller trades, which is exactly what happened during the October 2025 liquidation event when $19 billion in leveraged positions were wiped out.
최근 데이터는 시장 깊이가 왜 그 어느 때보다 중요한지를 보여줍니다. 2026년 4월 11일 코인텔레그래프 보도에 따르면, 비트코인 오더북 깊이(현재 가격 ±1% 이내 주문량)는 2025년 9월 이후 약 50% 감소했습니다. 과거 $1.8억~$2.6억이었던 것이 현재 $1.3억을 넘기 어려운 수준이며, 2026년 2월에는 약 10일간 $6,000만 아래로 떨어지기도 했습니다. 오더북이 얇을수록 적은 거래량으로도 가격이 급변할 수 있으며, 이는 2025년 10월 $190억 규모의 레버리지 포지션 청산 사태에서 정확히 일어난 일입니다.
The Depth Chart: A Visual Shortcut
Most exchanges also display a depth chart — a visual representation of the order book. The left side (green) shows cumulative buy orders, and the right side (red) shows cumulative sell orders. The point where they meet is the current price.
대부분의 거래소는 오더북을 시각적으로 표현한 **깊이 차트(Depth Chart)**도 제공합니다. 왼쪽(녹색)은 누적 매수 주문, 오른쪽(빨간색)은 누적 매도 주문을 보여주며, 두 선이 만나는 지점이 현재 가격입니다.
Look for walls — large, flat sections on either side. A buy wall is a massive cluster of buy orders at a single price, creating a green cliff on the depth chart. It suggests strong support at that price because a huge amount of capital is waiting to buy there. A sell wall is the opposite — a large cluster of sell orders creating a red cliff, suggesting resistance.
**벽(Wall)**을 찾아보세요 — 양쪽의 크고 평평한 구간입니다. **매수벽(Buy Wall)**은 단일 가격에 대량 매수 주문이 모인 것으로, 깊이 차트에서 녹색 절벽처럼 보입니다. 해당 가격에 막대한 자본이 매수 대기 중이므로 강한 지지를 의미합니다. **매도벽(Sell Wall)**은 반대로 대량 매도 주문이 모여 빨간 절벽을 만드는 것으로, 저항을 의미합니다.
However, walls are not always what they seem. This brings us to one of the most important lessons about order books.
하지만 벽이 항상 보이는 대로인 것은 아닙니다. 이것이 오더북에서 가장 중요한 교훈 중 하나입니다.
Spoofing and Fake Walls
Spoofing is when a trader places a very large order with no intention of executing it. The purpose is to trick other traders into thinking there is strong support or resistance at a certain level, manipulate the price, and then cancel the order before it gets filled.
**스푸핑(Spoofing)**은 트레이더가 실행할 의도 없이 매우 큰 주문을 넣는 행위입니다. 다른 트레이더들에게 특정 수준에 강한 지지나 저항이 있다고 착각하게 만들어 가격을 조작한 뒤, 체결 전에 주문을 취소하는 것이 목적입니다.
For example, a spoofer might place a 500 BTC buy wall at $73,500. Other traders see this and think “there is massive buying support at $73,500, so the price probably will not drop below that.” They buy confidently. Then the spoofer cancels the wall and dumps their own holdings at the now-inflated price.
예를 들어 스푸퍼가 $73,500에 500 BTC 매수벽을 세울 수 있습니다. 다른 트레이더들은 “$73,500에 엄청난 매수 지지가 있으니 가격이 그 아래로 떨어지지 않을 것”이라고 판단하고 안심하며 매수합니다. 그러면 스푸퍼는 벽을 취소하고 올라간 가격에 자신의 보유분을 매도합니다.
According to a CoinDesk investigation published on April 2, 2026, wash trading and spoofing remain “far more common than expected” in crypto markets, especially in smaller tokens and on lightly regulated exchanges. A TRM Labs report from January 2026 found that approximately 34% of trading volume in some tokens was artificially inflated through wash trading.
2026년 4월 2일 CoinDesk 조사에 따르면, 워시 트레이딩과 스푸핑은 암호화폐 시장에서 “예상보다 훨씬 흔하게” 발생하고 있으며, 특히 소형 토큰과 규제가 느슨한 거래소에서 심합니다. 2026년 1월 TRM Labs 보고서는 일부 토큰에서 거래량의 약 34%가 워시 트레이딩으로 인위적으로 부풀려졌다고 밝혔습니다.
How to spot spoofing: First, watch for walls that appear and disappear within seconds. Second, if a large order suddenly vanishes right as the price approaches it, that was likely a spoof. Third, compare the order book across multiple exchanges — real demand appears everywhere, spoofed walls appear on one exchange only. Fourth, use a heatmap tool if your exchange provides one — it shows historical order placement and cancellation patterns.
스푸핑 식별법: 첫째, 몇 초 만에 나타났다 사라지는 벽을 주시하세요. 둘째, 가격이 접근하자마자 대량 주문이 갑자기 사라지면 스푸핑일 가능성이 높습니다. 셋째, 여러 거래소의 오더북을 비교하세요 — 진짜 수요는 모든 거래소에 나타나지만, 스푸핑 벽은 한 거래소에서만 보입니다. 넷째, 거래소가 히트맵 도구를 제공하면 활용하세요 — 과거 주문 배치 및 취소 패턴을 보여줍니다.
Buy Walls vs. Sell Walls: What They Really Mean
A genuine buy wall — one that stays in place and actually gets filled — can act as a floor for the price. Whales or institutions accumulate at that level, absorbing sell pressure. When you see a large buy wall holding firm at a support level that also aligns with your technical analysis (RSI near oversold), it strengthens the case for a bounce.
진짜 매수벽 — 제자리에 유지되며 실제로 체결되는 벽 — 은 가격의 바닥 역할을 할 수 있습니다. 고래나 기관이 해당 수준에서 매집하며 매도 압력을 흡수합니다. 지지선에서 큰 매수벽이 버티고 있고 RSI가 과매도 구간이라면, 반등 가능성이 더 높아집니다.
A genuine sell wall works the opposite way. It caps price at a certain level because sellers are aggressively unloading. If the sell wall aligns with a resistance level on your chart, it strengthens the case that the price will struggle to break through.
진짜 매도벽은 반대로 작동합니다. 매도자들이 공격적으로 물량을 쏟아내기 때문에 특정 수준에서 가격을 제한합니다. 매도벽이 차트의 저항선과 일치하면 가격이 돌파하기 어려울 것이라는 근거가 강화됩니다.
But remember: walls can be fake (spoofing), and they can be eaten. A wall that looks intimidating can be consumed in minutes if a whale on the other side has enough capital. Never base your entire trade on a wall — use it as one piece of evidence alongside RSI, volume, moving averages, and support/resistance.
하지만 기억하세요: 벽은 가짜(스푸핑)일 수 있고, 먹힐 수도 있습니다. 위압적으로 보이는 벽도 반대편 고래가 충분한 자본을 투입하면 몇 분 만에 소화됩니다. 절대 벽 하나에만 기반해 거래하지 마세요 — RSI, 거래량, 이동평균, 지지·저항과 함께 하나의 근거로 활용하세요.
Maker vs. Taker: How Order Types Interact with the Book
When you place a limit order (e.g., “Buy 0.1 BTC at $73,500”), your order goes into the order book and waits. You are a maker — you “make” liquidity by adding an order to the book. Most exchanges reward makers with lower fees.
**지정가 주문(limit order)**을 넣으면 (예: “0.1 BTC를 $73,500에 매수”), 주문이 오더북에 등록되어 대기합니다. 이때 당신은 메이커(maker) — 오더북에 주문을 추가해 유동성을 “만드는” 역할입니다. 대부분의 거래소는 메이커에게 더 낮은 수수료를 제공합니다.
When you place a market order (e.g., “Buy 0.1 BTC at the current price right now”), your order immediately matches against existing orders in the book. You are a taker — you “take” liquidity from the book. Takers usually pay higher fees.
**시장가 주문(market order)**을 넣으면 (예: “0.1 BTC를 현재 가격에 즉시 매수”), 주문이 오더북의 기존 주문과 즉시 체결됩니다. 이때 당신은 테이커(taker) — 오더북에서 유동성을 “가져가는” 역할입니다. 테이커 수수료는 보통 더 높습니다.
For beginners, using limit orders is almost always better. You control your entry price, you pay lower fees, and you avoid slippage — the difference between the price you expected and the price you actually got. We will cover slippage in detail in an upcoming article.
초보자에게 지정가 주문은 거의 항상 더 유리합니다. 진입 가격을 직접 통제할 수 있고, 수수료가 낮으며, 슬리피지(기대한 가격과 실제 체결 가격의 차이)를 피할 수 있습니다. 슬리피지에 대해서는 곧 발행될 글에서 자세히 다루겠습니다.
Practical Order Book Reading: A 5-Step Process
Step 1 — Check the spread. If the spread is tight (< 0.1% for BTC), liquidity is healthy. If it is wide, be cautious.
1단계 — 스프레드 확인. 스프레드가 좁으면(BTC 기준 0.1% 미만) 유동성이 건강합니다. 넓으면 주의하세요.
Step 2 — Scan for walls. Look at the depth chart for any large green or red cliffs. Note their price levels.
2단계 — 벽 스캔. 깊이 차트에서 큰 녹색 또는 빨간 절벽을 찾고 가격대를 메모하세요.
Step 3 — Watch for 60 seconds. Do the walls stay? Or do they appear and vanish? Stable walls are more trustworthy.
3단계 — 60초 관찰. 벽이 유지되나요, 아니면 나타났다 사라지나요? 안정적인 벽이 더 신뢰할 만합니다.
Step 4 — Compare with your chart. Does the buy wall align with a support level? Does the sell wall match a resistance level? If yes, the signal is stronger.
4단계 — 차트와 비교. 매수벽이 지지선과 일치하나요? 매도벽이 저항선과 일치하나요? 일치하면 신호가 더 강합니다.
Step 5 — Decide your order type. If you want to enter near a buy wall, place a limit order slightly above it. If you want to exit near a sell wall, place a limit sell slightly below it. This increases your chance of getting filled before the wall absorbs all the volume.
5단계 — 주문 유형 결정. 매수벽 근처에서 진입하려면 벽 바로 위에 지정가 매수를 넣으세요. 매도벽 근처에서 청산하려면 벽 바로 아래에 지정가 매도를 넣으세요. 벽이 모든 물량을 흡수하기 전에 체결될 확률이 높아집니다.
Where to Practice
Open the BTC/USDT pair on Tapbit and watch the order book in real time. Tapbit displays bids, asks, spread, and a depth chart. Spend 10 minutes just watching — notice how fast orders appear and disappear, where walls form, and how the spread changes. Then try placing a small limit order and watch it appear in the book. This hands-on experience is worth more than any article.
Tapbit에서 BTC/USDT 거래쌍을 열고 오더북을 실시간으로 관찰하세요. Tapbit은 매수·매도 호가, 스프레드, 깊이 차트를 모두 표시합니다. 10분만 투자해서 주문이 얼마나 빠르게 나타나고 사라지는지, 벽이 어디에 형성되는지, 스프레드가 어떻게 변하는지 관찰하세요. 그 다음 소액 지정가 주문을 넣어보고 오더북에 나타나는 것을 직접 확인하세요. 이 실전 경험은 어떤 글보다 가치 있습니다.
You can also check aggregated order book data across exchanges on CoinGlass to see the bigger picture of Bitcoin liquidity.
CoinGlass에서 여러 거래소의 통합 오더북 데이터를 확인하면 비트코인 유동성의 전체 그림을 볼 수 있습니다.
Disclosure: This article contains affiliate links. We may earn a commission at no extra cost to you.
공개: 이 글에는 제휴 링크가 포함되어 있습니다. 추가 비용 없이 커미션을 받을 수 있습니다.