볼린저 밴드는 가격 변동성을 시각적으로 보여주는 지표로, 중심선(20일 이동평균선)과 상단·하단 밴드(표준편차 ×2)로 구성됩니다. 밴드가 좁아지면(스퀴즈) 큰 변동이 임박했다는 신호이고, 가격이 하단 밴드를 터치하면 과매도, 상단 밴드를 터치하면 과매수 가능성을 나타냅니다. 최근 XRP의 볼린저 밴드가 2026년 최고 수준의 스퀴즈를 기록했고, 비트코인은 $74K~$78K 사이에서 밴드 상단을 테스트 중입니다. 이 글에서는 볼린저 밴드의 구조, 3가지 핵심 전략(바운스, 스퀴즈, 밴드 워킹), TradingView 설정법, 그리고 다른 지표와 결합하는 방법을 초보자 눈높이에서 설명합니다.
What Are Bollinger Bands
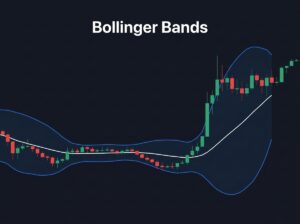
Bollinger Bands are a volatility indicator created by John Bollinger in the 1980s that has become one of the most widely used tools in both traditional finance and crypto trading. The indicator consists of three lines plotted on a price chart.
The middle band is a 20-period Simple Moving Average (SMA), which you already learned about in our moving average guide. This line shows the average price direction over the last 20 candles. The upper band is the middle band plus two standard deviations. The lower band is the middle band minus two standard deviations. Standard deviation is a mathematical measure of how much the price has been spreading out from its average.
In simple terms, the upper and lower bands create a channel that contains approximately 95 percent of all price action. When the price moves outside of this channel, something unusual is happening — and that is where trading opportunities appear.
What makes Bollinger Bands unique compared to other indicators is that the bands expand and contract based on real-time volatility. When the market is calm, the bands squeeze together. When the market is volatile, the bands spread apart. This dynamic behavior gives you information that static indicators cannot provide.
볼린저 밴드란 무엇인가
볼린저 밴드는 1980년대에 존 볼린저가 만든 변동성 지표로, 전통 금융과 크립토 트레이딩 모두에서 가장 널리 사용되는 도구 중 하나입니다. 이 지표는 가격 차트에 그려진 세 개의 선으로 구성됩니다.
중심 밴드는 20기간 단순 이동평균선(SMA)으로, 이동평균선 가이드에서 이미 배운 내용입니다. 이 선은 지난 20개 캔들의 평균 가격 방향을 보여줍니다. 상단 밴드는 중심 밴드에 표준편차 2를 더한 것입니다. 하단 밴드는 중심 밴드에서 표준편차 2를 뺀 것입니다. 표준편차는 가격이 평균에서 얼마나 퍼져 있는지를 수학적으로 측정한 것입니다.
간단히 말해, 상단과 하단 밴드는 모든 가격 움직임의 약 95%를 포함하는 채널을 만듭니다. 가격이 이 채널 밖으로 나가면 뭔가 비정상적인 일이 일어나고 있는 것이며 — 그곳에서 거래 기회가 나타납니다.
볼린저 밴드가 다른 지표와 다른 점은 밴드가 실시간 변동성에 따라 확장하고 수축한다는 것입니다. 시장이 잔잔하면 밴드가 좁아집니다. 시장이 변동성이 크면 밴드가 벌어집니다. 이 동적 행동은 정적 지표가 제공할 수 없는 정보를 줍니다.
Strategy 1 — The Bollinger Bounce
The most beginner-friendly Bollinger Band strategy is the bounce. This strategy is based on the principle that price tends to return to the middle band after touching the upper or lower band, like a rubber band snapping back to its natural position.
When the price touches or dips below the lower band, it signals that the asset may be oversold — too many sellers have pushed the price to an extreme. This is a potential buying opportunity. When the price touches or pushes above the upper band, it signals that the asset may be overbought — too many buyers have pushed the price to an extreme. This is a potential selling or profit-taking opportunity.
For example, Bitcoin recently tested the $78,000 area on April 17 after the Strait of Hormuz reopening news, touching the upper Bollinger Band on the daily chart. The price then pulled back to approximately $74,000, bouncing back toward the middle band. Traders who recognized the upper band touch as a potential overbought signal could have taken partial profits and avoided the pullback.
Important: the bounce strategy works best in ranging (sideways) markets. In strong trends, the price can “walk” along the upper or lower band for extended periods without bouncing back. Always confirm bounces with RSI — if the RSI is above 70 when price touches the upper band, the overbought signal is much stronger.
전략 1 — 볼린저 바운스
가장 초보자 친화적인 볼린저 밴드 전략은 바운스입니다. 이 전략은 가격이 상단 또는 하단 밴드를 터치한 후 중심 밴드로 돌아오는 경향이 있다는 원리에 기반합니다. 고무줄이 원래 위치로 되돌아가는 것과 같습니다.
가격이 하단 밴드를 터치하거나 아래로 내려가면, 자산이 과매도되었을 수 있다는 신호입니다 — 너무 많은 매도자가 가격을 극단으로 밀었습니다. 잠재적 매수 기회입니다. 가격이 상단 밴드를 터치하거나 위로 올라가면, 자산이 과매수되었을 수 있다는 신호입니다 — 너무 많은 매수자가 가격을 극단으로 밀었습니다. 잠재적 매도 또는 수익 실현 기회입니다.
예를 들어, 비트코인은 4월 17일 호르무즈 해협 재개방 뉴스 후 $78,000 영역을 테스트하며 일봉 차트에서 상단 볼린저 밴드를 터치했습니다. 가격은 이후 약 $74,000으로 하락하며 중심 밴드 방향으로 반등했습니다. 상단 밴드 터치를 잠재적 과매수 신호로 인식한 트레이더는 부분 수익 실현을 하고 하락을 피할 수 있었습니다.
중요: 바운스 전략은 횡보(레인지) 시장에서 가장 잘 작동합니다. 강한 추세에서는 가격이 상단 또는 하단 밴드를 따라 반등 없이 장기간 “걸어갈” 수 있습니다. 항상 RSI로 바운스를 확인하세요 — 가격이 상단 밴드를 터치할 때 RSI가 70 이상이면 과매수 신호가 훨씬 강해집니다.
Strategy 2 — The Bollinger Squeeze
The squeeze is the most powerful Bollinger Band signal and a favorite among professional traders. A squeeze occurs when the upper and lower bands contract and come very close together, indicating that volatility has dropped to an unusually low level. Low volatility always precedes high volatility — this is a market law. The squeeze tells you that a big move is coming, though it does not tell you which direction.
When you spot a squeeze on the chart, prepare for a breakout. If the price breaks above the upper band with strong volume, it signals a bullish breakout and a potential long entry. If the price breaks below the lower band with strong volume, it signals a bearish breakdown.
A real-world example is happening right now. According to recent market data, XRP’s Bollinger Bands hit a record 2026 tight squeeze, with analysts watching for a breakout from the $1.35 to $1.38 range. Bitcoin itself went through a squeeze in early April before breaking above $75,000 on the ceasefire news.
The key to trading the squeeze is patience. Do not enter before the breakout happens. Wait for the price to clearly break above the upper band or below the lower band, confirm the direction with volume, and then enter. Entering during the squeeze itself is a gamble because you do not know which direction the breakout will go.
전략 2 — 볼린저 스퀴즈
스퀴즈는 가장 강력한 볼린저 밴드 신호이며 전문 트레이더들이 선호하는 신호입니다. 스퀴즈는 상단과 하단 밴드가 수축하여 매우 가까워질 때 발생하며, 변동성이 비정상적으로 낮은 수준으로 떨어졌음을 나타냅니다. 낮은 변동성은 항상 높은 변동성을 앞섭니다 — 이것은 시장 법칙입니다. 스퀴즈는 큰 움직임이 오고 있다고 알려주지만, 어느 방향인지는 알려주지 않습니다.
차트에서 스퀴즈를 발견하면 돌파를 준비하세요. 가격이 강한 거래량과 함께 상단 밴드 위로 돌파하면 강세 돌파이며 잠재적 롱 진입 신호입니다. 가격이 강한 거래량과 함께 하단 밴드 아래로 이탈하면 약세 이탈 신호입니다.
실제 사례가 지금 벌어지고 있습니다. 최근 시장 데이터에 따르면, XRP의 볼린저 밴드가 2026년 최고 수준의 타이트 스퀴즈를 기록했으며 애널리스트들이 $1.35~$1.38 범위에서 돌파를 주시하고 있습니다. 비트코인 자체도 4월 초에 스퀴즈를 거친 후 휴전 뉴스에 $75,000 위로 돌파했습니다.
스퀴즈 거래의 핵심은 인내입니다. 돌파 전에 진입하지 마세요. 가격이 상단 밴드 위 또는 하단 밴드 아래로 명확히 돌파할 때까지 기다리고, 거래량으로 방향을 확인한 다음 진입하세요. 스퀴즈 자체 중에 진입하는 것은 돌파 방향을 모르기 때문에 도박입니다.
Strategy 3 — Band Walking
Band walking occurs during strong trends when the price stays near or repeatedly touches one band without returning to the middle. In a strong uptrend, the price “walks” along the upper band — each candle closes near the upper band, pulls back slightly, then returns to the upper band again. In a strong downtrend, the price walks along the lower band.
This is important because beginners often make the mistake of shorting when the price touches the upper band, expecting a bounce back to the middle. During a band walk, that bounce never comes. The trend is too strong.
How to identify a band walk: the price touches the upper (or lower) band at least three times in a row without crossing the middle band. The MACD shows strong momentum in the trend direction. The volume remains consistently high.
During Bitcoin’s rally from $68,000 to $78,000 in mid-April, the price walked along the upper Bollinger Band on the 4-hour chart for several days. Traders who tried to short the upper band touches lost money, while those who recognized the band walk and rode the trend profited.
The lesson: do not fight a band walk. If you see one forming, trade in the direction of the walk, not against it.
전략 3 — 밴드 워킹
밴드 워킹은 강한 추세 중에 가격이 중심으로 돌아가지 않고 한쪽 밴드 근처에 머물거나 반복적으로 터치할 때 발생합니다. 강한 상승 추세에서 가격은 상단 밴드를 따라 “걷습니다” — 각 캔들이 상단 밴드 근처에서 마감하고, 약간 후퇴한 다음, 다시 상단 밴드로 돌아갑니다. 강한 하락 추세에서는 하단 밴드를 따라 걷습니다.
이것이 중요한 이유는 초보자들이 종종 가격이 상단 밴드를 터치하면 중심으로 반등할 것을 기대하며 숏을 치는 실수를 하기 때문입니다. 밴드 워킹 중에는 그 반등이 오지 않습니다. 추세가 너무 강합니다.
밴드 워킹 식별법: 가격이 중심 밴드를 교차하지 않고 상단(또는 하단) 밴드를 최소 세 번 연속 터치합니다. MACD가 추세 방향으로 강한 모멘텀을 보여줍니다. 거래량이 지속적으로 높게 유지됩니다.
4월 중순 비트코인이 $68,000에서 $78,000으로 랠리하는 동안, 4시간 차트에서 가격이 며칠간 상단 볼린저 밴드를 따라 걸었습니다. 상단 밴드 터치에 숏을 친 트레이더는 손실을 봤고, 밴드 워킹을 인식하고 추세를 탄 트레이더는 수익을 냈습니다.
교훈: 밴드 워킹에 맞서 싸우지 마세요. 형성되는 것이 보이면, 반대가 아닌 워킹 방향으로 거래하세요.
How to Set Up Bollinger Bands on TradingView
Open TradingView and load any crypto chart. Click the “Indicators” button at the top. Search for “Bollinger Bands” and add the indicator created by TradingView. The default settings are 20-period length and 2 standard deviations — these are the standard settings that John Bollinger recommended, and they work well for most crypto trading on daily and 4-hour charts.
You will see three lines appear on your chart: the upper band, the middle band (20 SMA), and the lower band. The area between the upper and lower bands is often shaded, making it easy to see the width of the channel.
For the best results, combine Bollinger Bands with the indicators you already know. When the price touches the lower band AND the RSI is below 30, the oversold signal is very strong. When you spot a squeeze AND the MACD is about to cross, the breakout signal is more reliable. Always check volume to confirm any Bollinger Band signal — a breakout with low volume is likely a fake-out.
TradingView에서 볼린저 밴드 설정하는 방법
TradingView를 열고 아무 크립토 차트를 로드하세요. 상단의 “Indicators” 버튼을 클릭합니다. “Bollinger Bands”를 검색하고 TradingView가 만든 지표를 추가하세요. 기본 설정은 20기간 길이와 표준편차 2입니다 — 존 볼린저가 추천한 표준 설정이며 일봉과 4시간 차트의 대부분 크립토 거래에 잘 작동합니다.
차트에 세 개의 선이 나타납니다: 상단 밴드, 중심 밴드(20 SMA), 하단 밴드. 상단과 하단 밴드 사이 영역은 종종 음영 처리되어 채널의 너비를 쉽게 볼 수 있습니다.
최고의 결과를 위해 이미 알고 있는 지표들과 볼린저 밴드를 결합하세요. 가격이 하단 밴드를 터치하면서 RSI가 30 아래이면 과매도 신호가 매우 강합니다. 스퀴즈를 발견하면서 MACD가 크로스 직전이면 돌파 신호가 더 신뢰할 수 있습니다. 항상 거래량으로 볼린저 밴드 신호를 확인하세요 — 낮은 거래량의 돌파는 가짜일 가능성이 높습니다.
Common Bollinger Band Mistakes
The first mistake is using Bollinger Bands alone. Bollinger Bands tell you about volatility and potential extremes, but they do not tell you about trend direction or momentum. Always combine them with at least one other indicator like RSI, MACD, or support and resistance levels.
The second mistake is shorting every upper band touch. As we discussed in the band walking section, during strong uptrends the price can stay at the upper band for days or weeks. Blindly shorting upper band touches without checking the trend will result in losses.
The third mistake is assuming the price must stay inside the bands. While 95 percent of price action occurs within the bands, the remaining 5 percent can be extreme and sustained. A breakout above the upper band with massive volume can mark the start of a new trend, not the end of one.
The fourth mistake is using the wrong time frame. Bollinger Bands on a 1-minute chart will give you dozens of false signals per day. For crypto trading, the daily chart and 4-hour chart are the most reliable time frames for Bollinger Band analysis.
흔한 볼린저 밴드 실수
첫 번째 실수는 볼린저 밴드만 단독으로 사용하는 것입니다. 볼린저 밴드는 변동성과 잠재적 극단에 대해 알려주지만, 추세 방향이나 모멘텀에 대해서는 알려주지 않습니다. 항상 RSI, MACD, 또는 지지·저항 수준 같은 최소 하나의 다른 지표와 결합하세요.
두 번째 실수는 상단 밴드 터치마다 숏을 치는 것입니다. 밴드 워킹 섹션에서 논의했듯이, 강한 상승 추세에서 가격은 며칠 또는 몇 주 동안 상단 밴드에 머물 수 있습니다. 추세를 확인하지 않고 맹목적으로 상단 밴드 터치에 숏을 치면 손실이 발생합니다.
세 번째 실수는 가격이 반드시 밴드 안에 머물러야 한다고 가정하는 것입니다. 가격 움직임의 95%가 밴드 내에서 발생하지만, 나머지 5%는 극단적이고 지속될 수 있습니다. 대규모 거래량과 함께 상단 밴드 위로 돌파하면 추세의 끝이 아니라 새로운 추세의 시작일 수 있습니다.
네 번째 실수는 잘못된 시간대를 사용하는 것입니다. 1분 차트의 볼린저 밴드는 하루에 수십 개의 거짓 신호를 줍니다. 크립토 거래에서 일봉 차트와 4시간 차트가 볼린저 밴드 분석에 가장 신뢰할 수 있는 시간대입니다.
Start Using Bollinger Bands Today
Bollinger Bands add a volatility dimension to your analysis that no other indicator provides. Combined with RSI for momentum, MACD for trend direction, volume for confirmation, and support and resistance for key levels, you now have a complete technical analysis toolkit.
Practice spotting squeezes, bounces, and band walks on Tapbit, which provides real-time charting with all major indicators including Bollinger Bands. Set your profit targets and stop-losses before entering any trade.
오늘부터 볼린저 밴드를 사용하세요
볼린저 밴드는 다른 지표가 제공하지 못하는 변동성 차원을 분석에 추가합니다. 모멘텀을 위한 RSI, 추세 방향을 위한 MACD, 확인을 위한 거래량, 핵심 레벨을 위한 지지·저항과 결합하면, 이제 완전한 기술적 분석 도구 키트를 갖추게 됩니다.
Tapbit에서 스퀴즈, 바운스, 밴드 워킹을 실전 연습하세요. 볼린저 밴드를 포함한 모든 주요 지표가 포함된 실시간 차트를 제공합니다. 거래 진입 전 수익 목표와 손절을 설정하세요.
Disclosure: This article contains affiliate links. We may earn a commission at no extra cost to you.