Bitcoin Price Analysis May 2026: Is the Four-Year Cycle Dead or Just Stretching?
There’s a question hanging over every Bitcoin holder’s head right now, and it’s not just “when will the price go back up.” It’s something deeper: does the playbook that worked for the last decade still apply at all?
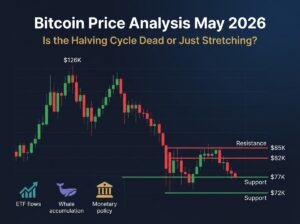
Bitcoin hit an all-time high of $126,000 in October 2025. As of late May 2026, it’s hovering around $77,000 — roughly 40% below that peak. If you’ve been in crypto for a while, you might think this is just the normal post-halving cooldown. But a growing number of analysts, from Cathie Wood to JPMorgan, are saying the four-year cycle as we knew it might be over. In this Bitcoin price analysis May 2026, we’ll walk through what’s actually happening, why the price is stuck where it is, and what you should be paying attention to going forward.
What Does the Market Look Like Right Now?
Let’s start with the basics. Bitcoin closed May 25 at around $76,700, and on May 26 it’s trading near $77,250. That might sound stable, but zoom out and the picture tells a different story. BTC has been grinding between roughly $70,000 and $81,000 for most of 2026, never quite breaking out, never quite collapsing.
The Fear and Greed Index — a popular gauge of market sentiment — sat at 34 on May 25, which falls in “Fear” territory. For context, it hit Extreme Fear (a reading of 10) back in late March when Bitcoin briefly dipped below $71,000. It hasn’t touched “Greed” levels since late 2025. The mood is cautious at best.
Meanwhile, Bitcoin dominance — the share of Bitcoin in the total crypto market — stands at about 58%. That’s firmly in what the industry calls “Bitcoin Season,” meaning most altcoins are underperforming BTC. The Altcoin Season Index reads just 27 out of 100, confirming that money isn’t rotating into smaller coins yet. The total crypto market cap is around $2.68 trillion, but most of that weight is concentrated in Bitcoin itself.
One technical detail worth knowing: Bitcoin is currently trading below its 200-day moving average, which sits near $82,455. In traditional analysis, when the price stays below this level, the market is considered to be in a bearish trend. Historically, Bitcoin has also always found long-term bottoms near its 200-week moving average, which is currently around $57,900. That number might sound scary if you’re holding at $77K, but understanding where these levels sit helps frame the range of realistic outcomes.
The Fed Is the Elephant in the Room
If you want to understand why Bitcoin can’t seem to break above $80,000, you have to look beyond the crypto charts. The biggest force pushing against risk assets right now is the Federal Reserve.
At its April 29 meeting, the Fed held interest rates steady, but the tone was anything but comforting. The vote came with the highest level of internal dissent since 1992, and Chair Jerome Powell made it clear that rate cuts are essentially off the table for the rest of 2026. The Fed also raised its inflation forecast to 2.7%, up from 2.4%, largely because rising energy prices — an oil shock, in Powell’s words — are complicating the fight against inflation.
For Bitcoin, this matters because BTC now trades like a macro asset. It moves in tight correlation with tech stocks and responds to the same risk-on, risk-off dynamics that drive the Nasdaq. When Treasury yields rise (the 2-year recently hit 4.09%), big money rotates into bonds because they offer safer returns. When a surprise CPI print came in at 3.8%, the probability of a rate hike jumped to 44%, and Bitcoin dropped 5% in a single day.
The simple version: as long as the Fed stays hawkish, it’s hard for Bitcoin to sustain rallies above $80K. Institutional funds don’t buy Bitcoin aggressively when government bonds are offering 4%+ yields with no risk.
ETF Flows: The New Heartbeat of Bitcoin’s Price
If the Fed sets the macro backdrop, ETF flows are the mechanism through which institutional money actually enters and exits Bitcoin. And in May 2026, those flows have told two very different stories depending on which week you look at.
April was Bitcoin ETFs’ best month of the year. About $2 billion flowed in on a net basis, almost entirely driven by BlackRock’s IBIT fund alone. Cumulative inflows since spot Bitcoin ETFs launched in January 2024 reached $58 billion, and total net assets crossed $103 billion. That momentum carried into early May — on May 1, a single-day inflow of $630 million marked the biggest one-day buying since mid-April, and on May 4, another $532 million came in as BTC briefly touched $81,000.
Then the mood flipped. The week ending May 15 saw $1 billion in net outflows — the largest weekly redemption since late January. That one week broke a six-week streak that had pulled in $3.4 billion at an average of $568 million per week. The heaviest outflow day was Wednesday, May 13, when $635 million left in a single session. ARK’s ARKB fund lost $324 million that week, BlackRock’s IBIT shed $317 million, and Fidelity’s FBTC gave back $259 million.
The selling continued into the following week: May 19 saw another $782 million exit the market.
What’s interesting is that while Bitcoin and Ethereum ETFs were bleeding, altcoin ETFs actually attracted money. XRP ETFs took in $60.5 million and Solana ETFs pulled in $58 million during the same week that BTC ETFs lost a billion dollars. This suggests some institutions aren’t leaving crypto entirely — they’re rotating within it.
The bottom line on ETF flows is this: they’ve replaced the halving as the primary driver of Bitcoin’s price action. When institutions are buying, Bitcoin rises almost regardless of everything else. When they’re selling, it falls. ETF flows are the tide, and right now, that tide is uncertain.
Whales Are Buying What Retail Is Selling
Here’s where it gets interesting for anyone thinking about the longer term. While the price charts and ETF flows paint a mixed picture, on-chain data tells a clearer story: large holders are accumulating aggressively.
The number of Bitcoin wallets holding 100 BTC or more — typically associated with institutions, family offices, and high-net-worth individuals — has reached 20,229, a new 2026 high. That’s an 11.2% increase compared to a year ago, according to data from Santiment. During the worst week of selling in February, whale wallets in the 10-to-10,000 BTC range added over 18,000 BTC in a single week.
What these large holders are doing with that Bitcoin is equally telling: they’re moving it off exchanges and into cold storage. That’s the crypto equivalent of buying shares and locking them in a vault. When liquid supply on exchanges drops while accumulation continues, it creates the conditions for what analysts call a supply shock — a situation where even a modest uptick in demand can cause a sharp price spike because there simply aren’t enough coins available to sell.
Other on-chain metrics support the idea that the market may be closer to a bottom than a further breakdown. The MVRV ratio — a measure of whether the average holder is in profit or loss — dipped to negative 29% in mid-February, a level historically associated with previous cycle bottoms. Trading volume was crushed at the lows, falling 61% in a single week, which is the kind of capitulation that often precedes a reversal.
Meanwhile, the opposite is happening on Ethereum. About 60 mega-whale wallets holding 10,000 or more ETH completely emptied their positions in May. That’s millions of dollars rotating out of ETH and, in many cases, directly into Bitcoin. It paints a picture of institutional money choosing the safety and liquidity of Bitcoin over the utility-based value proposition of Ethereum and other altcoins — at least for now.
So Is the Halving Cycle Actually Dead?
This is the most important question in crypto right now, and the honest answer is that the smartest people in the industry don’t agree.
For a decade, Bitcoin followed a remarkably consistent rhythm. The halving happens (reducing new supply by half), a bull market peaks about 12 to 18 months later, then a brutal bear market follows, then quiet accumulation, then the next halving resets the clock. It worked in 2012–2013, 2016–2017, and 2020–2021.
The April 2024 halving was supposed to set up a euphoric 2025. And in one sense it did — Bitcoin reached $126,000 in October 2025. But then it started falling, and by early 2026 the market had taken an $8.7 billion single-week realized loss, the second-largest in Bitcoin’s history. The year after a halving finished in the red for the first time ever.
One camp — which includes Cathie Wood, Arthur Hayes, Matt Hougan of Bitwise, Raoul Pal, CryptoQuant’s Ki Young Ju, and analysts at Grayscale, JPMorgan, and Bernstein — argues the cycle is structurally broken. Their reasoning is arithmetic: spot ETFs now move $500 million or more in a single day, while daily miner production is worth only about $40 million. ETF flows overwhelm the supply change by an order of magnitude, making the halving’s “supply shock” irrelevant. They also point out that the average ETF cost basis sits around $80,000, and institutional mandates don’t allow panic-selling — creating a structural floor that makes classic 70–80% drawdowns almost impossible. What replaces the four-year cycle, they argue, is a longer, gentler regime with smaller booms and shallower busts.
A second camp — including Morgan Stanley, Peter Brandt, and 10x Research’s Markus Thielen — says the cycle isn’t dead, just stretched. The current 40% drawdown from peak is entirely consistent with an attenuated cycle. Brandt projects an October 2026 bottom, based on the observation that previous bear markets ended 12 to 18 months before the next halving (April 2028), which puts the floor in late 2026 or early 2027. PlanB has argued that traders who believe in the cycle are actually pre-emptively selling in anticipation of it, which makes the cycle self-fulfilling.
There’s also a third view worth considering: maybe the cycle itself didn’t break, but our expectations around it did. Bitcoin delivered a 40% correction — that’s normal for a post-peak year. What didn’t happen was the euphoric altseason, the retail frenzy, or the “everything goes up” phase. The cycle stretched and softened, but the broader crypto market simply didn’t get the party it was expecting.
What all three camps agree on is the underlying cause: ETFs, institutional treasury buying, and Bitcoin’s integration into the broader macro landscape have fundamentally changed how BTC’s price gets set. The debate is about how much of the old pattern survives, not whether the landscape has shifted.
Bitcoin Price Analysis May 2026: Key Levels Worth Watching
Understanding support and resistance helps you make sense of where Bitcoin might go next, even if you’re not a chart trader.
The most important support level right now is the $77,000 zone. This area aligns with the 50-day moving average, and on-chain data shows that large whale orders are clustered here, which means big buyers are actively bidding at this price. Below that, the next meaningful support sits between $72,000 and $72,760 — a zone that TradingView’s community analysis has flagged as heavy support. If that breaks, the psychological $70,000 level comes into play, and a worst-case scenario would be a retest of the 200-week moving average near $58,000, which has historically marked the absolute bottom of every Bitcoin bear market.
On the upside, $80,000 is the immediate hurdle — BTC has failed to hold above it multiple times in May. Above that, the 200-day moving average at $82,455 is the line that separates a bearish market structure from a bullish one. If Bitcoin reclaims that level convincingly, institutional buying models would activate, and the next target would be $85,000.
For a broader structural read, Bitcoin dropped below the weekly Ichimoku Cloud back in February — a signal that has historically preceded the deepest and most painful phases of bear markets. It hasn’t reclaimed the cloud since, which keeps the longer-term technical picture cautious.
What Should You Be Watching Next?
Rather than trying to predict where Bitcoin goes, it’s more useful to know what catalysts could move it — and in which direction.
The most immediate event is CME Group launching 24/7 crypto futures trading on May 29. This eliminates the traditional weekend gap and gives institutional traders the ability to hedge around the clock. If weekend volume picks up meaningfully, it could compress risk premiums and tighten the spread between CME futures and crypto-native exchanges. We covered this in detail earlier this week.
Right behind that, CME’s Bitcoin Volatility Futures (BVX) launch on June 1, giving institutions a new tool to hedge volatility directly. Here’s our breakdown of how BVX works.
Beyond specific events, the macro variables matter most. Any dovish signal from the Fed — even hinting at one rate cut in 2026 — would likely spark a sharp rally. On the other hand, another hot inflation print or hawkish surprise could push BTC back toward the $72K support. ETF flows remain the best real-time barometer: sustained weekly inflows above $500 million would be bullish, while continued outflows suggest the market hasn’t found its footing yet.
On the regulatory front, the CLARITY Act passed the Senate Banking Committee 15-9 in May and is heading to the full Senate. If it becomes law, it would create the first comprehensive regulatory framework for digital assets in the U.S. — a potential unlock for institutional capital that’s been sitting on the sidelines waiting for legal clarity.
And keep an eye on whale behavior. As long as the 100+ BTC wallet count keeps climbing and exchange reserves keep falling, the structural floor under Bitcoin’s price holds. If that trend reverses — if whales start depositing back to exchanges — it’s an early warning sign of deeper trouble.
The Bottom Line
This Bitcoin price analysis May 2026 points to a market caught between two forces. On one side, macro headwinds — a hawkish Fed, rising yields, and sticky inflation — are capping upside and triggering periodic ETF outflows. On the other, large holders are accumulating at a pace not seen in several quarters, exchange supply is thinning, and the structural case for Bitcoin as a long-term store of value continues to strengthen.
Whether the four-year cycle is dead or just stretching is ultimately a question of timeframe. For short-term traders, the old playbook clearly doesn’t work the way it used to. For long-term holders, the data suggests this might be an accumulation phase that precedes the next major leg up — but the timing depends on macro factors that no one can predict with certainty.
The honest takeaway is that Bitcoin has grown up. The price of that maturity is that the easy mental model is gone. What replaces it is a messier, evidence-based approach that requires watching ETF flows, Fed policy, on-chain data, and regulation all at once. It’s harder than buying after the halving and selling 18 months later — but it’s also the reality of an asset class that now commands $100 billion in ETF assets and trades in lockstep with global markets.
If you’re looking to start building positions or practicing strategies during this period, platforms like Tapbit offer both spot and futures trading with low fees — a good option for beginners who want to get comfortable with the mechanics before the next major move.