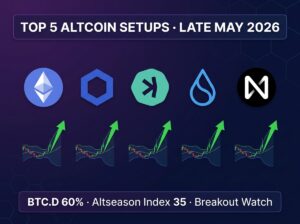
Altcoin breakout May 2026 candidates are lining up as Bitcoin dominance holds near 60% and the Altcoin Season Index reads just 35. Capital hasn’t rotated yet, but five coins — ETH, LINK, KAS, SUI, and NEAR — show compressed volatility, whale accumulation, and specific catalysts that historically precede large moves. This article breaks down each altcoin breakout May 2026 setup with defined trigger levels, targets, and invalidation points so beginners can learn how professional traders read these patterns.
The Macro Backdrop: Why Altcoins Haven’t Moved Yet
Bitcoin Dominance Holds the Key
Any altcoin breakout May 2026 thesis depends on one chart: Bitcoin dominance (BTC.D).
Bitcoin dominance (BTC.D) broke above its eight-month accumulation range between 58% and 60% in April 2026 and now tests the 61% resistance level. Until BTC.D rolls over, capital stays concentrated in Bitcoin rather than flowing into altcoins. The prior cycle high at 66% represents the next resistance if the breakout continues. However, momentum indicators on BTC.D are showing signs of exhaustion — the weekly RSI was recently rejected from bullish territory, and the MACD printed a bearish cross. A rejection at 61% and a move below 59.6% (the 0.236 Fibonacci retracement) would be the first technical signal that altcoin rotation is beginning.
The Altcoin Season Index
The Altcoin Season Index from Blockchaincenter.net reads 35, well below the 75 threshold that defines altcoin season. This means fewer than 35% of the top 50 altcoins have outperformed Bitcoin over the past 90 days. However, the index was at similar levels before the 2017 and 2021 altcoin explosions. The index is a lagging indicator — it confirms a rotation already underway, not one about to start. Leading indicators like BTC.D breakdown, whale accumulation, and individual chart compression provide earlier signals.
Market Snapshot (May 18, 2026)
The total crypto market cap is approximately $2.64 trillion. Bitcoin trades near $76,900, down roughly 2.6% on the day amid rate-hike fears and whale profit-taking. Ethereum sits around $2,250. The Fear & Greed Index is neutral at 47. These conditions describe a market in consolidation — not yet trending, but coiling for a move.
How to Read These Setups: A Framework for Beginners
Before diving into individual coins, here is the framework this article uses for each setup. Professional traders look for a specific combination of signals before entering altcoin breakout trades.
The first element is volatility compression — measured by Bollinger Bandwidth (BBWP) and Average True Range (ATR). When these indicators reach historical lows, a large move becomes statistically likely within 7–14 trading days. The direction is not guaranteed, only the magnitude.
The second element is a defined trigger level. Every setup has a specific price where the breakout (or breakdown) begins. This removes guesswork and makes trade planning mechanical.
The third element is a fundamental catalyst with a specific date. Chart setups without catalysts can stay compressed for months. Catalysts provide the spark that forces price resolution.
The fourth element is whale or on-chain confirmation. Rising whale balances, falling exchange supply, or increasing large-transaction counts add conviction that smart money agrees with the technical picture.
Setup #1: Ethereum (ETH) — Ascending Channel Defense at $2,200
Technical Picture
Ethereum trades near $2,250 after correcting from its August 2025 all-time high at $4,956. Since the February 2026 low at $1,748, ETH has climbed inside an ascending parallel channel on the daily chart. The current price sits near the 0.382 Fibonacci retracement at $2,264, with channel support flexing through $2,200. Bollinger Bandwidth is below normal, and RSI sits below its own descending trendline near 50, confirming volatility compression.
The breakout trigger is a sustained daily close above $2,400, which aligns with the prior pivot supply and the upper channel boundary. The measured move target from a confirmed breakout points toward $2,700 initially, with the deeper supply band between $3,400 and $3,600. The invalidation level is a daily close below $2,140 (the 0.618 Fibonacci retracement), which would weaken the bullish case and put $2,000 back in play.
Catalyst
The Glamsterdam hard fork (ePBS, Block-Level Access Lists, gas limit to 200M) is tentatively scheduled for mid-2026. Layer 2 activity has already surged after the Fusaka upgrade raised blob capacity from 6 to 48 per block. Analyst models project ETH trading between $2,250 and $2,657 in May 2026, with the $2,420 breakout being the key trigger.
On-Chain Signal
In early May 2026, whale wallets acquired approximately 140,000 ETH (roughly $322 million) within just four days. Ethereum’s TVL remains above $45 billion with over 54% dominance across tracked DeFi chains.
Setup #2: Chainlink (LINK) — Ascending Triangle at $10 Resistance
Technical Picture
LINK trades around $9.70–$10.35 after pulling back from its August 2025 swing high near $31. Since February 2026, a textbook ascending triangle has formed on the daily chart — price defends a rising trendline from the $7 low and presses against horizontal resistance at $10. Weekly RSI bottomed in early 2026 and is curling back toward 50. BBWP prints stacked low-volatility bars that flag compression before expansion.
The breakout trigger is a confirmed daily close above $10, which projects a measured move toward $11.92 initially, with the next supply zone between $13 and $17–18 on the weekly chart. The invalidation level is a break of the rising trendline, opening a path to $8, with $6.80 as the bearish target.
Catalyst
The OpenAssets partnership (announced April 2026) routes tokenization flow from ICE, Tether, Fanatics, and Mysten Labs through Chainlink oracles. Additionally, the CCIP v1.5 mainnet rollout and a $644 million buyback program reinforce the real-world asset narrative. Chainlink’s oracle infrastructure is becoming indispensable as tokenized real-world assets grow.
On-Chain Signal
Whale wallets holding 100,000 to 10 million LINK accumulated approximately 32.9 million additional tokens recently — a 7.7% expansion. According to Cointelegraph, citing Santiment data, this level of whale accumulation has historically preceded price appreciation for LINK.
Setup #3: Kaspa (KAS) — Falling Wedge With Hard Fork Catalyst
Technical Picture
KAS trades around $0.0325 after a deep drawdown from its 2024 peak above $0.20. The weekly chart shows a maturing falling wedge that has compressed price action since late 2024. Falling wedges resolve higher in the majority of historical cases. Main support sits near $0.030, the floor that has contained price since January 2026. Weekly volume is contracting, BBWP shows persistent low-volatility bars, and RSI has broken above its descending trendline and is now retesting that line as new support.
The breakout trigger is a weekly close above the upper wedge boundary (approximately $0.038), projecting toward $0.054 first, then $0.075. The invalidation level is a daily close below $0.028, which would break the wedge support and open a deeper correction.
Catalyst
The Toccata hard fork hit code freeze on April 15 with mainnet activation targeted between June 5 and June 20, 2026. Toccata introduces native KRC-20 tokens, programmable covenants via the Silverscript compiler, and base-layer zero-knowledge verification — effectively bringing smart contract functionality to Kaspa’s BlockDAG architecture for the first time. Pre-fork accumulation historically frontruns these activations, making late May the cleanest entry window.
On-Chain Signal
KAS is a smaller-cap asset, so whale tracking is less mature than ETH or LINK. However, exchange supply has been declining since March 2026, consistent with accumulation into private wallets.
Setup #4: Sui (SUI) — Range Floor Defense With CME Futures Tailwind
Technical Picture
SUI trades near $0.91–$1.21 after a steep correction from its 2025 all-time high above $5.30. Price has spent the entire year of 2026 grinding around the $0.90 support shelf. On the weekly chart, BBWP shows extremely low volatility, while RSI hovers near oversold levels without yet flipping bullish.
A successful defense of $0.90 flips the chart, with the bullish target at the 0.786 Fibonacci retracement near $1.43, followed by the 0.618 golden pocket at $2.27. A breakdown below $0.85 opens a deep dive toward the 1.0 Fibonacci extension at $0.355.
Catalyst
CME Group launched regulated SUI futures on May 4, 2026, opening a direct institutional rail. Standard contracts (50,000 SUI) and micro contracts (5,000 SUI) are both available. Layered on top, the Grayscale Sui Trust S-1 filing and the 21Shares 2x SUI ETF launch tighten the structural bid. SUI surged 4.18% in 24 hours after the CME listing, with 108.7 million SUI staked and $3.13 million in liquidations — showing institutional interest is real, though early.
On-Chain Signal
SUI’s weekly performance has been among the strongest in the Layer 1 category (up 10–18% depending on the week), suggesting accumulation despite the broader macro weakness. The CME futures data (Yahoo Finance shows May 2026 contract last price at $1.21 with settlement May 29) provides a transparent institutional reference point.
Setup #5: NEAR Protocol (NEAR) — Multi-Year Trendline Test With AI Narrative
Technical Picture
NEAR trades at approximately $1.30 after months of basing inside its long-term support zone. Price compresses against a multi-year descending trendline that connects the 2022 high near $20 with the 2024 lower high. BBWP prints low volatility, and the weekly RSI is testing its own descending trendline — a break of that RSI line typically precedes a strong directional move.
A clean breakout above the descending trendline would clear the way to the first target at $1.78 (short-term), then $3.30 (confluence zone), and ultimately $8 (the double-peak zone from 2024). The invalidation level is a weekly close below $1.10, which would signal that the base has failed.
Catalyst
NEAR Protocol has pivoted to user-owned AI, with its 2026 roadmap prioritizing scaling toward one million transactions per second alongside AI-Intents. Recent launches include IronClaw, NEAR AI Cloud, and a TEE-secured GPU marketplace, already reaching more than 100 million users. Pending spot NEAR ETF filings from Grayscale and Bitwise serve as a wildcard upside trigger. With daily volume above $350 million, NEAR remains a liquid Layer 1 asset.
On-Chain Signal
NEAR’s price prediction models project a range of $1.30–$1.78 for May 2026, with CoinDCX noting a 14% surge recently driven by rising buying pressure. The AI narrative provides a differentiated catalyst from the other four setups.
Summary Table
| Coin | Price (May 18) | Breakout Trigger | Target | Invalidation | Catalyst | Catalyst Date |
|---|---|---|---|---|---|---|
| ETH | ~$2,250 | Daily close > $2,400 | $2,700 → $3,400 | < $2,140 | Glamsterdam fork + whale buying | Mid-2026 |
| LINK | ~$10 | Daily close > $10 | $11.92 → $13–17 | Trendline break → $8 | OpenAssets + CCIP v1.5 + $644M buyback | May–June 2026 |
| KAS | ~$0.033 | Weekly close > $0.038 | $0.054 → $0.075 | < $0.028 | Toccata hard fork (smart contracts) | June 5–20 |
| SUI | ~$1.05 | Hold $0.90 + reclaim $1.21 | $1.43 → $2.27 | < $0.85 | CME futures + Grayscale S-1 + 21Shares ETF | Live (May 4) |
| NEAR | ~$1.30 | Break descending trendline | $1.78 → $3.30 | < $1.10 | AI pivot + NEAR AI Cloud + ETF filings | Ongoing 2026 |
What Beginners Should Remember
These setups are educational frameworks, not buy signals. In any market, 40% or more of compressed-volatility setups resolve to the downside. The purpose of defined trigger and invalidation levels is to remove emotion from the decision. If the trigger hits, the setup is active. If invalidation hits first, the setup is dead — walk away without hesitation.
Three practical steps for beginners watching these setups: first, monitor BTC.D — if it breaks below 59.6%, altcoin rotation odds increase significantly. Second, check the Altcoin Season Index weekly — a move above 50 would be the earliest confirmation of a regime change. Third, never allocate more than you can afford to lose on any single altcoin position, especially in a market that is still technically in Bitcoin Season.
For those looking to gain initial exposure through a simpler approach, consider starting with spot positions and dollar-cost averaging rather than trying to time breakouts perfectly. Sign up on Tapbit to begin with basic spot trading and build your understanding of price action step by step.
For more context on the macro environment shaping these setups, see our previous coverage on Ethereum’s Glamsterdam upgrade, the U.S. Bitcoin Strategic Reserve, Solana ETFs in 2026, and CME Bitcoin Volatility Futures.
Ready to practice reading chart setups with real market data? Create your Tapbit account here and start observing these levels in real time.
Understanding how to evaluate an altcoin breakout May 2026 setup — trigger, target, invalidation — is a skill that applies to every future market cycle.