Two years ago this month, on April 19, 2024, Bitcoin’s block reward was cut in half — from 6.25 BTC to 3.125 BTC per block. This was the fourth halving in Bitcoin’s history, and every previous one triggered a massive price rally within 12 to 18 months.
This cycle has been different. Bitcoin hit an all-time high of approximately $126,000 in October 2025 — just 18 months after the halving — then crashed 52% to around $60,000 by February 2026. As of late April 2026, BTC trades near $78,000, roughly 15% above its halving-day price of $64,000 but still 38% below the cycle peak.
So where does that leave us? Is the four-year cycle dead, or are we simply in the messy middle that every cycle goes through? This article breaks down the data, compares this cycle to the previous three, and explains what it means for your trading decisions.
2년 전인 2024년 4월 19일, 비트코인의 블록 보상이 반으로 줄었습니다 — 블록당 6.25 BTC에서 3.125 BTC로. 이것은 비트코인 역사상 네 번째 반감기였으며, 이전 모든 반감기는 12~18개월 내에 대규모 가격 상승을 촉발했습니다.
이번 사이클은 달랐습니다. 비트코인은 반감기 후 약 18개월 만인 2025년 10월에 약 $126,000의 사상 최고가를 기록했다가, 2026년 2월까지 52% 폭락하여 약 $60,000까지 떨어졌습니다. 2026년 4월 말 현재 BTC는 약 $78,000에 거래되며, 반감기 당일 가격 $64,000보다 약 15% 높지만 사이클 최고점보다 38% 낮습니다.
그러면 우리는 지금 어디에 있을까요? 4년 주기가 끝난 것인가, 아니면 모든 사이클이 겪는 혼란스러운 중간 지점에 있는 것인가? 이 글에서는 데이터를 분석하고, 이번 사이클을 이전 세 차례와 비교하며, 거래 결정에 어떤 의미가 있는지 설명합니다.
What Is a Bitcoin Halving?
Every 210,000 blocks — roughly every four years — the Bitcoin network automatically cuts the number of new BTC created per block by 50%. This is hardcoded into Bitcoin’s protocol and cannot be changed by anyone.
The purpose is simple: control inflation. Bitcoin’s total supply is capped at 21 million coins. By cutting the creation rate in half every four years, the protocol ensures that the last Bitcoin will not be mined until approximately 2140.
Here is the full history:
| Halving | Date | Block Reward | Daily New BTC | BTC Price on Halving Day | Peak Price After | Time to Peak |
|---|---|---|---|---|---|---|
| 1st | Nov 28, 2012 | 50 → 25 BTC | 7,200 → 3,600 | $12 | $1,150 | 12 months |
| 2nd | Jul 9, 2016 | 25 → 12.5 BTC | 3,600 → 1,800 | $660 | $19,800 | 17 months |
| 3rd | May 11, 2020 | 12.5 → 6.25 BTC | 1,800 → 900 | $8,600 | $69,000 | 18 months |
| 4th | Apr 19, 2024 | 6.25 → 3.125 BTC | 900 → 450 | $64,000 | $126,000 | 18 months |
The pattern across the first three halvings was remarkably consistent: price peaked 12 to 18 months after the halving, then entered a bear market for 12 to 18 months before bottoming and beginning the next cycle.
210,000 블록마다 — 약 4년마다 — 비트코인 네트워크는 블록당 생성되는 새 BTC 수를 자동으로 50% 줄입니다. 이것은 비트코인 프로토콜에 하드코딩되어 있으며 누구도 변경할 수 없습니다.
목적은 간단합니다: 인플레이션 통제. 비트코인의 총 공급량은 2,100만 개로 제한됩니다. 4년마다 생성률을 반으로 줄여 마지막 비트코인이 약 2140년까지 채굴되지 않도록 보장합니다.
| 반감기 | 날짜 | 블록 보상 | 일일 신규 BTC | 반감기 당일 가격 | 이후 최고가 | 최고점 도달 시간 |
|---|---|---|---|---|---|---|
| 1차 | 2012년 11월 28일 | 50 → 25 BTC | 7,200 → 3,600 | $12 | $1,150 | 12개월 |
| 2차 | 2016년 7월 9일 | 25 → 12.5 BTC | 3,600 → 1,800 | $660 | $19,800 | 17개월 |
| 3차 | 2020년 5월 11일 | 12.5 → 6.25 BTC | 1,800 → 900 | $8,600 | $69,000 | 18개월 |
| 4차 | 2024년 4월 19일 | 6.25 → 3.125 BTC | 900 → 450 | $64,000 | $126,000 | 18개월 |
처음 세 차례 반감기의 패턴은 놀랍도록 일관적이었습니다: 반감기 후 12~18개월에 가격이 최고점에 도달한 뒤, 12~18개월의 약세장에 진입하고 바닥을 찍은 후 다음 사이클이 시작되었습니다.
How This Cycle Compares: The Numbers
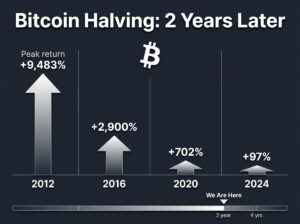
The 2024 halving cycle hit its peak faster than many expected — $126,000 in October 2025, just 18 months after the halving. But the rally from halving day to peak was “only” about 97% (from $64,000 to $126,000). Compare that to previous cycles:
| Cycle | Halving Price → Peak | Return | 2 Years After Halving Price | 2-Year Return |
|---|---|---|---|---|
| 1st (2012) | $12 → $1,150 | +9,483% | ~$240 (Nov 2014) | +1,900% |
| 2nd (2016) | $660 → $19,800 | +2,900% | ~$8,500 (Jul 2018) | +1,188% |
| 3rd (2020) | $8,600 → $69,000 | +702% | ~$29,000 (May 2022) | +237% |
| 4th (2024) | $64,000 → $126,000 | +97% | ~$78,000 (Apr 2026) | +22% |
The trend is clear: each cycle’s peak return has been dramatically smaller than the last. The first cycle delivered nearly 9,500%. This one delivered 97%. And two years after the halving, BTC is up only about 22% — the weakest two-year performance of any cycle on record.
Kaiko Research called this “the weakest post-halving performance on record.” But that does not necessarily mean the cycle is broken. It may simply mean the cycle is maturing.
2024년 반감기 사이클은 많은 사람의 예상보다 빠르게 최고점에 도달했습니다 — 반감기 후 불과 18개월 만에 2025년 10월 $126,000. 그러나 반감기일부터 최고점까지의 상승률은 “겨우” 약 97%($64,000 → $126,000)였습니다. 이전 사이클과 비교해보면:
| 사이클 | 반감기 가격 → 최고점 | 수익률 | 반감기 2년 후 가격 | 2년 수익률 |
|---|---|---|---|---|
| 1차 (2012) | $12 → $1,150 | +9,483% | ~$240 (2014년 11월) | +1,900% |
| 2차 (2016) | $660 → $19,800 | +2,900% | ~$8,500 (2018년 7월) | +1,188% |
| 3차 (2020) | $8,600 → $69,000 | +702% | ~$29,000 (2022년 5월) | +237% |
| 4차 (2024) | $64,000 → $126,000 | +97% | ~$78,000 (2026년 4월) | +22% |
추세는 명확합니다: 각 사이클의 최고 수익률이 이전보다 극적으로 줄었습니다. 첫 사이클은 거의 9,500%를 기록했고, 이번 사이클은 97%였습니다. 반감기 2년 후 BTC는 약 22%만 상승 — 역대 사이클 중 가장 약한 2년 성과입니다.
Kaiko Research는 이를 “역대 가장 약한 반감기 후 성과”라고 평가했습니다. 하지만 이것이 사이클이 깨졌다는 의미는 아닙니다. 단지 사이클이 성숙하고 있다는 의미일 수 있습니다.
Why This Cycle Is Different: Three Structural Changes
1. Bitcoin’s market cap is 100× larger. When Bitcoin halved in 2012, its market cap was about $130 million. Today it is roughly $1.5 trillion. Moving a $130 million asset 9,000% requires a few hundred million dollars. Moving a $1.5 trillion asset the same percentage would require more money than the GDP of most countries. Diminishing percentage returns are a mathematical inevitability as the asset grows.
2. Institutional players changed the game. Spot Bitcoin ETFs launched in January 2024. By April 2026, BlackRock’s IBIT alone holds over $50 billion in Bitcoin. In the week of April 17, 2026, US spot Bitcoin ETFs recorded $996 million in weekly inflows, with $664 million flowing in on a single day (April 17). Strategy (formerly MicroStrategy) bought 34,164 BTC in a single purchase. These institutional flows create different market dynamics than the retail-driven cycles of 2012–2020. They add demand but also add sophisticated selling pressure during drawdowns.
3. Miners are pivoting to AI. After the halving cut rewards to 3.125 BTC per block, many miners cannot cover electricity costs at current prices. Mining costs surged to approximately $137,000 per BTC when the hashrate hit 1 ZH/s in December 2025. The hashrate has since dropped about 4% year-to-date to around 1 ZH/s, the first quarterly decline in six years. Bloomberg reports that listed mining companies could derive 70% of their revenue from AI and high-performance computing by end of 2026, up from under 10% in 2024. This means miners are selling BTC to fund data center construction — adding sell pressure that did not exist in previous cycles.
1. 비트코인 시가총액이 100배 커졌습니다. 2012년 반감기 때 시가총액은 약 1.3억 달러였습니다. 현재는 약 1.5조 달러입니다. 1.3억 달러 자산을 9,000% 움직이려면 수억 달러가 필요합니다. 1.5조 달러 자산을 같은 비율로 움직이려면 대부분의 국가 GDP보다 많은 돈이 필요합니다. 자산이 성장할수록 수익률 감소는 수학적으로 불가피합니다.
2. 기관 투자자가 게임을 바꿨습니다. 비트코인 현물 ETF가 2024년 1월 출시되었습니다. 2026년 4월까지 BlackRock의 IBIT만 500억 달러 이상의 비트코인을 보유합니다. 2026년 4월 17일 주간에 미국 현물 비트코인 ETF는 주간 9.96억 달러의 순유입을 기록했고, 4월 17일 하루에만 6.64억 달러가 유입되었습니다. Strategy(구 MicroStrategy)는 단일 매수로 34,164 BTC를 구매했습니다. 이러한 기관 자금 흐름은 2012~2020년 개인 투자자 중심 사이클과는 다른 시장 역학을 만듭니다.
3. 채굴업체가 AI로 전환하고 있습니다. 반감기가 보상을 블록당 3.125 BTC로 줄인 후, 많은 채굴업체가 현재 가격으로 전기료를 감당할 수 없습니다. 해시레이트가 2025년 12월 1 ZH/s에 도달했을 때 채굴 비용은 BTC당 약 $137,000까지 급등했습니다. 해시레이트는 이후 연초 대비 약 4% 하락하여 약 1 ZH/s로, 6년 만에 첫 분기 하락입니다. Bloomberg는 상장 채굴 회사들이 2026년 말까지 수익의 70%를 AI와 고성능 컴퓨팅에서 얻을 수 있다고 보도합니다(2024년에는 10% 미만). 이는 채굴업체가 데이터 센터 건설 자금을 위해 BTC를 매도하고 있다는 의미로, 이전 사이클에는 없었던 매도 압력을 추가합니다.
The Supply Shock Is Real — But Slower
The math of the halving is undeniable. Daily new BTC issuance dropped from 900 to 450 coins on halving day. At $78,000 per BTC, that means approximately $35 million in new supply enters the market daily — down from about $70 million before the halving at the same price.
Bitcoin’s annualized inflation rate is now below 0.85%, lower than gold’s estimated 1.5–2% annual supply growth. Over the next two years heading into the 2028 halving (expected around April 2028, block 1,050,000), roughly 105,000 blocks remain in the current epoch. After the next halving, daily issuance drops further to approximately 225 BTC.
The supply squeeze is cumulative. Each halving makes the effect of the previous one more pronounced. But in this cycle, the demand side has been more volatile due to geopolitical shocks (the Hormuz crisis, the October 2025 liquidation cascade of $19 billion) and the macro environment (US inflation projected at 2.7% for 2026, rates staying higher for longer).
반감기의 수학은 부인할 수 없습니다. 반감기 당일 일일 신규 BTC 발행량이 900개에서 450개로 줄었습니다. BTC당 $78,000 기준, 매일 약 3,500만 달러의 새 공급이 시장에 진입합니다 — 같은 가격에서 반감기 전 약 7,000만 달러에서 줄었습니다.
비트코인의 연간 인플레이션율은 이제 0.85% 미만으로, 금의 추정 연간 공급 성장률 1.5~2%보다 낮습니다. 2028년 반감기(2028년 4월경, 블록 1,050,000 예상)까지 약 105,000 블록이 현재 에포크에 남아 있습니다. 다음 반감기 후 일일 발행량은 약 225 BTC로 더 줄어듭니다.
공급 압축은 누적적입니다. 각 반감기는 이전 것의 효과를 더욱 두드러지게 합니다. 하지만 이번 사이클에서는 지정학적 충격(호르무즈 위기, 2025년 10월 190억 달러 청산 연쇄)과 거시 환경(2026년 미국 인플레이션 2.7% 전망, 금리 장기 고수준 유지)으로 수요 측면이 더 변동적이었습니다.
Is the Four-Year Cycle Dead?
This is the biggest debate in crypto right now. There are credible arguments on both sides.
Arguments that the cycle is broken:
The 2024 cycle peaked earlier (month 18) and with a smaller gain (97%) than any previous cycle. The crash from $126,000 to $60,000 happened faster and deeper than the typical post-peak decline in previous cycles. Institutional flows now dominate, and institutions do not follow four-year patterns — they follow Fed policy, risk appetite, and portfolio allocation models. Epoch Ventures declared the “end of the four-year halving cycle” in their 2026 outlook, arguing that institutional adoption has permanently altered Bitcoin’s market structure.
Arguments that the cycle is alive:
Every previous cycle saw a 50–80% drawdown from peak before resuming an uptrend. The current drawdown ($126,000 → $60,000 = 52%) fits within that range. Bitcoin at $78,000 is still above the halving-day price of $64,000, consistent with every previous cycle’s behavior at the two-year mark. Fidelity Digital Assets published research asking “Is Bitcoin’s Four-Year Cycle Over?” and concluded that while the cycle is evolving, the halving’s supply reduction remains a fundamental driver that has not been priced out.
The honest answer: The four-year cycle is probably not dead, but it is fading. Each halving reduces block rewards by a smaller absolute amount ($35M/day vs $70M/day is meaningful, but it is a fraction of the $3+ billion in daily spot volume). The supply-side catalyst still exists, but it needs demand-side catalysts — like ETF inflows, regulation clarity, or geopolitical safe-haven demand — to produce the kind of rallies we saw in previous cycles.
이것은 현재 암호화폐에서 가장 큰 논쟁입니다. 양쪽 모두 신뢰할 수 있는 주장이 있습니다.
사이클이 깨졌다는 주장: 2024년 사이클은 이전보다 더 일찍(18개월) 더 작은 상승률(97%)로 정점에 도달했습니다. $126,000에서 $60,000으로의 폭락은 이전 사이클의 전형적인 정점 후 하락보다 빠르고 깊었습니다. 기관 자금 흐름이 지배하며, 기관은 4년 패턴이 아닌 연준 정책, 위험 선호도, 포트폴리오 배분 모델을 따릅니다.
사이클이 살아있다는 주장: 모든 이전 사이클은 최고점에서 50~80% 하락 후 상승 추세를 재개했습니다. 현재 하락($126,000 → $60,000 = 52%)은 그 범위 내입니다. $78,000의 비트코인은 반감기 당일 가격 $64,000보다 여전히 높으며, 2년 시점에서 모든 이전 사이클의 행동과 일치합니다.
솔직한 답변: 4년 주기는 아마 죽지 않았지만 약해지고 있습니다. 각 반감기는 더 작은 절대 금액으로 블록 보상을 줄입니다. 공급측 촉매제는 여전히 존재하지만, 이전 사이클에서 본 것과 같은 상승을 만들려면 ETF 유입, 규제 명확성, 지정학적 안전자산 수요 같은 수요측 촉매제가 필요합니다.
Three Scenarios for the Next 12 Months (May 2026 – April 2027)
Scenario 1: The Cycle Holds — BTC reaches $100,000–$150,000
If ETF inflows continue accelerating (they hit $996M/week in mid-April), the CLARITY Act passes providing regulatory clarity, and the Fed begins cutting rates in H2 2026, Bitcoin could retest the $126,000 ATH and potentially push higher. Epoch Ventures predicts $150,000 by year-end. The Fibonacci 61.8% retracement from the $60K low to $126K high sits at $100,788 — a natural magnet if bullish momentum builds.
Scenario 2: Extended Consolidation — BTC trades $65,000–$90,000
This is the “boring middle” scenario. Institutional accumulation continues slowly, miner selling provides constant overhead resistance, and macro uncertainty keeps Bitcoin range-bound. This resembles mid-2018 or mid-2022. In this case, patience and dollar-cost averaging win.
Scenario 3: Cycle Breaks Down — BTC retests $50,000–$60,000
If the CLARITY Act fails (Polymarket odds at 38%), the Fed raises rates further, geopolitical risks escalate (Hormuz full closure, oil above $150), and ETF outflows resume, Bitcoin could retest the February 2026 low of $60,000 or potentially fall to $50,000. The 2016 and 2020 cycles both saw 2-year drawdowns of 60–70% before recovering.
시나리오 1: 사이클 유지 — BTC $100,000~$150,000 도달. ETF 유입이 계속 가속되고, CLARITY Act가 통과하여 규제 명확성을 제공하며, 연준이 2026년 하반기 금리 인하를 시작하면, 비트코인은 $126,000 ATH를 재시험하고 더 높이 갈 수 있습니다. 피보나치 61.8% 되돌림($60K~$126K)은 $100,788에 있습니다.
시나리오 2: 장기 횡보 — BTC $65,000~$90,000 거래. 기관 축적이 서서히 계속되고, 채굴업체 매도가 지속적인 상방 저항을 제공하며, 거시 불확실성이 비트코인을 박스권에 가둡니다. 이 경우 인내와 정액 분할 매수가 승리합니다.
시나리오 3: 사이클 붕괴 — BTC $50,000~$60,000 재시험. CLARITY Act가 실패하고, 연준이 금리를 더 올리며, 지정학적 리스크가 고조되고, ETF 유출이 재개되면, 비트코인은 2026년 2월 저점 $60,000을 재시험하거나 $50,000까지 하락할 수 있습니다.
What This Means for Your Trading
The halving does not tell you what to do tomorrow. It tells you where you are in a multi-year cycle. Here are the practical takeaways:
Do not expect 2012-style returns. The days of 9,000% post-halving rallies are over. A 50–100% gain from current levels ($78K → $117K–$156K) would actually be a strong outcome for this cycle. Adjust your expectations.
Watch ETF flows more than halving charts. In 2024–2026, ETF inflows and outflows have been more predictive of short-term price direction than any halving model. Track them weekly on CoinGlass.
Understand the miner dynamic. Miners now sell BTC to fund AI infrastructure. This is a persistent, structural sell pressure that did not exist in previous cycles. When miner revenue drops (hashprice currently around $31/PH/s, down 12% in 30 days), selling accelerates.
Use the halving as context, not a signal. Bitcoin’s inflation rate below 0.85% makes it the hardest monetary asset on the planet. Over multi-year horizons, that matters enormously. Over the next month, it matters less than what the Fed says, whether Hormuz stays open, and whether ETFs are buying or selling.
Set alerts, not emotions. Key levels: support at $74,000 (current Fibonacci 23.6%), $67,000 (most-tested 2026 support), $60,000 (February low). Resistance at $85,212 (Fibonacci 38.2%), $93,000 (50%), $100,788 (61.8% golden zone). Use your trading journal to log decisions at each level.
반감기가 내일 무엇을 할지 알려주지 않습니다. 다년간 사이클에서 어디에 있는지 알려줍니다. 실용적인 핵심 사항:
2012년식 수익률을 기대하지 마세요. 반감기 후 9,000% 상승의 시대는 끝났습니다. 현재 수준에서 50~100% 상승($78K → $117K~$156K)이 이번 사이클에서 실제로 강한 결과입니다.
반감기 차트보다 ETF 자금 흐름을 주시하세요. 2024~2026년에 ETF 유입과 유출이 어떤 반감기 모델보다 단기 가격 방향을 더 잘 예측했습니다. CoinGlass에서 매주 추적하세요.
채굴업체 역학을 이해하세요. 채굴업체가 이제 AI 인프라 자금을 위해 BTC를 매도합니다. 이전 사이클에 없던 지속적, 구조적 매도 압력입니다.
반감기를 신호가 아닌 맥락으로 활용하세요. 0.85% 미만의 인플레이션율로 비트코인은 지구상에서 가장 단단한 화폐 자산입니다. 다년간 지평에서 이것은 매우 중요합니다. 다음 달에는 연준 발언, 호르무즈 개방 여부, ETF 매수/매도 여부보다 덜 중요합니다.
감정이 아닌 알림을 설정하세요. 주요 레벨: 지지선 $74,000(피보나치 23.6%), $67,000(2026년 가장 많이 테스트된 지지), $60,000(2월 저점). 저항선 $85,212(피보나치 38.2%), $93,000(50%), $100,788(61.8% 골든존). 거래 일지에 각 레벨에서의 결정을 기록하세요.
Quick Summary
Bitcoin is two years past its fourth halving. Price rose 97% from $64,000 to $126,000 (peak in October 2025) — the smallest post-halving rally on record. Currently trading at $78,000, up only 22% from halving day. Daily new supply: 450 BTC ($35M/day). Inflation rate: below 0.85%. Hashrate: ~1 ZH/s. Miners pivoting to AI, selling BTC. ETFs turned net positive in April ($996M weekly inflows). The four-year cycle is not dead but fading — institutional flows, regulation, and macro conditions now matter more than the halving alone. Next halving: April 2028.
비트코인은 네 번째 반감기 이후 2년이 지났습니다. 가격은 $64,000에서 $126,000까지 97% 상승(2025년 10월 최고점) — 역대 가장 작은 반감기 후 상승. 현재 $78,000에 거래, 반감기일 대비 22%만 상승. 일일 신규 공급: 450 BTC($3,500만/일). 인플레이션율: 0.85% 미만. 해시레이트: ~1 ZH/s. 채굴업체 AI 전환 중, BTC 매도. ETF 4월 순유입 전환(주간 $9.96억). 4년 주기는 죽지 않았지만 약해지는 중 — 기관 자금 흐름, 규제, 거시 조건이 반감기 단독보다 더 중요. 다음 반감기: 2028년 4월.
Practice: Open your portfolio on Tapbit and calculate your personal return since the April 2024 halving. Compare it to Bitcoin’s +22%. If you are below that, review your trading journal entries to identify where you deviated from your plan. If you are above, identify what you did right and repeat it.
연습: Tapbit에서 포트폴리오를 열고 2024년 4월 반감기 이후 개인 수익률을 계산하세요. 비트코인의 +22%와 비교하세요. 그보다 낮다면 거래 일지를 검토해 계획에서 벗어난 지점을 확인하세요. 높다면 잘한 점을 파악하고 반복하세요.
Disclosure: This article contains affiliate links. We may earn a commission at no extra cost to you.