If you own any altcoin right now — ETH, SOL, ADA, LINK, or anything that is not Bitcoin — you have probably noticed something frustrating. Bitcoin drops 38% from its all-time high, but your altcoins drop 50%, 60%, even 70%. Bitcoin recovers a little, your altcoins barely move. It feels like the entire market is designed to punish everything except Bitcoin.
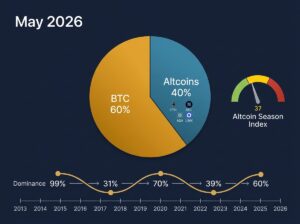
That feeling has a name and a number: Bitcoin dominance. As of May 2026, BTC dominance has reached 60.6%, the highest level since March 2021. Understanding what this number means, why it moves, and what it signals for your portfolio is one of the most important things a crypto beginner can learn — because it explains why “the market” is not one thing. It is two things: Bitcoin, and everything else.
지금 ETH, SOL, ADA, LINK 등 비트코인이 아닌 알트코인을 보유하고 있다면, 답답한 현상을 느꼈을 것입니다. 비트코인이 사상 최고가 대비 –38% 하락했는데, 내 알트코인은 –50%, –60%, 심지어 –70%까지 떨어집니다. 비트코인이 조금 회복하면 내 알트코인은 꿈쩍도 안 합니다. 시장 전체가 비트코인 빼고 다 벌주는 구조처럼 느껴집니다.
그 느낌에는 이름과 숫자가 있습니다: 비트코인 도미넌스. 2026년 5월 현재 BTC 도미넌스는 60.6%로, 2021년 3월 이후 최고치입니다. 이 숫자가 무엇을 의미하는지, 왜 움직이는지, 내 포트폴리오에 어떤 신호를 보내는지를 이해하는 것은 크립토 초보자가 배울 수 있는 가장 중요한 것 중 하나입니다 — 왜냐하면 “시장”이 하나가 아니라 두 개라는 것을 설명하기 때문입니다: 비트코인, 그리고 나머지 전부.
What Is Bitcoin Dominance?
Bitcoin dominance (BTC.D) is a simple ratio: Bitcoin’s market capitalization divided by the total market capitalization of all cryptocurrencies, expressed as a percentage.
As of May 5, 2026, the total crypto market cap is approximately $2.76 trillion. Bitcoin’s market cap is about $1.55 trillion. That gives a dominance of roughly 56–61% depending on the data source (CoinMarketCap, CoinGecko, and TradingView calculate slightly differently due to which tokens they include).
When dominance rises, it means Bitcoin is gaining market share — either because Bitcoin’s price is rising faster than altcoins, or because altcoins are falling harder than Bitcoin. When dominance falls, it means altcoins are outperforming Bitcoin on a relative basis, even if both are going up.
This is the critical distinction most beginners miss: dominance is about relative performance, not absolute price. Bitcoin can be falling and dominance can still rise — if altcoins are falling faster.
비트코인 도미넌스(BTC.D)는 단순한 비율입니다: 비트코인 시가총액 ÷ 전체 암호화폐 시가총액 × 100%.
2026년 5월 5일 기준, 전체 크립토 시가총액은 약 $2.76조, 비트코인 시가총액은 약 $1.55조입니다. 도미넌스는 대략 56~61%(데이터 소스마다 포함 토큰이 달라 약간의 차이가 있습니다).
도미넌스가 오르면 비트코인이 시장 점유율을 확대하고 있다는 뜻입니다 — 비트코인 가격이 알트코인보다 빨리 오르거나, 알트코인이 비트코인보다 더 크게 떨어지기 때문입니다. 도미넌스가 내리면 알트코인이 상대적으로 비트코인을 이기고 있다는 뜻입니다.
대부분의 초보자가 놓치는 핵심: 도미넌스는 상대적 성과이지, 절대 가격이 아닙니다. 비트코인이 하락 중이어도 알트코인이 더 크게 하락하면 도미넌스는 올라갑니다.
The 12-Year History: From 99% to 31% and Back
Bitcoin dominance has swung dramatically over its history. CoinGecko’s comprehensive study shows the full trajectory:
| Period | Average BTC.D | Low | High | What Happened |
|---|---|---|---|---|
| 2013 | 93.3% | 87.4% | 99.1% | Bitcoin was essentially the entire market |
| 2017 | 58.5% | 37.5% | 87.2% | ICO boom — thousands of new tokens launched |
| 2018 | 44.6% | 31.1% | 57.1% | All-time low: Jan 16, 2018 at 31.1% |
| 2019–2020 | 60–63% | 48.8% | 72.4% | Flight back to quality, pre-halving accumulation |
| 2021 | 47.6% | 37.8% | 70.7% | The great alt season — DeFi, NFTs, meme coins |
| 2022 | 39.3% | 35.9% | 45.6% | Everything crashed equally (Terra, FTX) |
| 2023 | 45.6% | 37.5% | 51.6% | Recovery began, BTC led |
| 2024 | 51.9% | 47.3% | 57.4% | ETF launch, halving, institutional flows |
| 2025 | 59.3% | 53.0% | 63.2% | BTC went mainstream, alts struggled |
| 2026 (YTD) | ~60% | ~56% | ~61% | 3rd consecutive year of rising dominance |
The pattern across 12 years is clear: dominance follows cycles. It rises when fear dominates and capital concentrates in Bitcoin as the safest crypto asset. It falls when greed takes over and capital rotates into higher-risk, higher-reward altcoins. Understanding where we are in that cycle tells you more about your altcoin portfolio than any single chart pattern.
비트코인 도미넌스는 12년간 극적으로 변동해왔습니다. CoinGecko의 종합 연구가 전체 궤적을 보여줍니다 (위 표 참조).
12년간의 패턴은 명확합니다: 도미넌스는 사이클을 따릅니다. 공포가 지배하고 자금이 가장 안전한 크립토 자산인 비트코인에 집중될 때 오릅니다. 탐욕이 지배하고 자금이 고위험·고수익 알트코인으로 회전할 때 내립니다. 이 사이클에서 현재 어디에 있는지를 이해하면, 어떤 개별 차트 패턴보다 내 알트코인 포트폴리오에 대해 더 많은 것을 알 수 있습니다.
Why Is Dominance at 60% Right Now?
Three forces are pushing dominance to its highest level since 2021:
Institutional ETF concentration. Spot Bitcoin ETFs reversed outflows to pull in $1.32 billion in March 2026 alone, with total assets under management exceeding $96 billion. BlackRock’s IBIT and Fidelity’s FBTC are the primary recipients. These ETFs buy Bitcoin only — they do not buy ETH, SOL, or any altcoin. Every dollar flowing into a Bitcoin ETF directly increases BTC’s share of the total market. There is no equivalent capital pipeline for most altcoins yet.
Flight to quality during fear. The Fear and Greed Index hit 5 in February 2026 and remains at 39 (Fear) as of early May. When fear dominates, retail traders sell their most volatile positions first — which means altcoins. Institutional holders keep their Bitcoin because it has the deepest liquidity and clearest regulatory status. The result: altcoins fall harder, Bitcoin holds relatively better, and dominance climbs.
ETH/BTC ratio collapse. The ETH/BTC ratio fell to approximately 0.028 earlier in 2026, the lowest level since the pre-DeFi era of 2020. When Ethereum — the largest altcoin by market cap — is underperforming Bitcoin by this much, it drags the entire altcoin market down and pushes BTC dominance higher. The ratio has recently rebounded above 0.030, but analysts say Ethereum needs to reclaim 0.035 on a weekly close to signal a meaningful reversal.
세 가지 힘이 도미넌스를 2021년 이후 최고치로 밀어 올리고 있습니다:
기관 ETF 집중. 현물 비트코인 ETF는 2026년 3월에만 $13.2억 유입을 기록했고, 총 운용자산은 $960억을 넘었습니다. 이 ETF들은 비트코인만 삽니다 — ETH, SOL, 알트코인은 사지 않습니다. 비트코인 ETF에 들어가는 모든 달러가 BTC의 시장 점유율을 직접 끌어올립니다.
공포 구간의 안전자산 선호. Fear & Greed 지수가 2월에 5까지 떨어졌고, 5월 초 현재 39(Fear)입니다. 공포가 지배하면 소매 트레이더들은 가장 변동성 큰 포지션 — 알트코인 — 을 먼저 팝니다. 기관은 유동성이 깊고 규제 지위가 명확한 비트코인을 유지합니다.
ETH/BTC 비율 붕괴. ETH/BTC 비율이 2026년 초 약 0.028까지 떨어졌습니다 — 2020년 DeFi 이전 이후 최저치입니다. 시총 1위 알트코인인 이더리움이 비트코인을 이 정도로 밑돌면, 전체 알트코인 시장을 끌어내리고 BTC 도미넌스를 높입니다.
What 60% Dominance Means for Your Altcoin Portfolio
If dominance is at 60%, it means that for every $100 in the crypto market, $60 is in Bitcoin and only $40 is split among roughly 15,000 other tokens. That $40 has to serve Ethereum ($233B market cap), Solana, XRP, ADA, LINK, DOGE, and thousands of smaller tokens.
Here is what this means in practical terms:
Your altcoin is competing for a shrinking pool of capital. When dominance rises from 50% to 60%, approximately $200–$300 billion worth of market share shifts from altcoins to Bitcoin (based on a $2.7T total market). That is money leaving the altcoin ecosystem.
Price recovery is harder for altcoins during high dominance. Even if the total market goes up 10%, Bitcoin might go up 12% while altcoins go up 5%. You are holding the slower horse. This does not mean altcoins will not recover — it means the recovery will be uneven and Bitcoin-led until dominance starts declining.
Not all altcoins suffer equally. During the 2025–2026 dominance rise, ETH dropped 50%, SOL dropped 60%, but some RWA tokens gained 185% (CoinDCX data). Sector rotation happens even within the altcoin market. Tokens tied to strong narratives (AI, RWA, staking) can outperform even during Bitcoin season.
도미넌스가 60%라는 것은 크립토 시장의 $100 중 $60이 비트코인에 있고, 나머지 $40만 약 15,000개 다른 토큰에 분배된다는 뜻입니다.
실전적 의미:
내 알트코인은 줄어드는 자금 풀을 놓고 경쟁하고 있습니다. 도미넌스가 50%→60%로 오르면 약 $2,000~$3,000억 규모의 시장 점유율이 알트코인에서 비트코인으로 이동합니다.
높은 도미넌스 구간에서는 알트코인 가격 회복이 더 어렵습니다. 전체 시장이 10% 올라도 비트코인은 12%, 알트코인은 5%만 오를 수 있습니다.
모든 알트코인이 동일하게 고통받지는 않습니다. 2025~2026년 도미넌스 상승 중 ETH –50%, SOL –60%이지만, 일부 RWA 토큰은 +185%를 기록했습니다. 강한 내러티브(AI, RWA, 스테이킹)와 연결된 토큰은 비트코인 시즌에서도 초과 수익을 낼 수 있습니다.
The Altcoin Season Index: Where Are We Now?
The Altcoin Season Index, maintained by BlockchainCenter.net, measures what percentage of the top 50 altcoins have outperformed Bitcoin over the past 90 days. The scale runs from 0 to 100:
- 75 or above = Altcoin Season (most altcoins beating Bitcoin)
- 25 or below = Bitcoin Season (Bitcoin beating most altcoins)
- 26–74 = Transitional zone
As of early May 2026, the index is hovering around 37–43, firmly in the transitional-to-Bitcoin-season zone. The last confirmed Altcoin Season reading above 75 was in September 2025 (index hit 78), which lasted only about 3 weeks before dominance resumed its climb.
The most bearish signal for altcoins is when both metrics align against them: dominance rising AND the Altcoin Season Index falling. That is the current configuration. However, historically, this alignment tends to mark the point of maximum pessimism rather than the start of a new bearish trend.
알트코인 시즌 지수(BlockchainCenter.net)는 상위 50개 알트코인 중 지난 90일간 비트코인을 이긴 비율을 측정합니다. 75 이상이면 알트코인 시즌, 25 이하면 비트코인 시즌입니다.
2026년 5월 초 기준 지수는 37~43으로, 전환~비트코인 시즌 구간에 있습니다. 75 이상을 기록한 마지막 확정 알트코인 시즌은 2025년 9월(78)이었으며, 약 3주 만에 끝났습니다.
알트코인에 가장 약세 신호는 도미넌스 상승 + 알트코인 시즌 지수 하락이 동시에 나타날 때입니다. 지금이 바로 그 상황입니다. 그러나 역사적으로 이 조합은 새로운 약세 추세의 시작이 아니라 최대 비관의 지점이 되는 경향이 있습니다.
When Does Dominance Peak? The Historical Triggers
Every major altcoin season in the past six years was preceded by a BTC dominance peak. The lag between the peak and the start of the altcoin rally ranged from 2 to 6 months.
| Dominance Peak | Level | What Followed | Lag to Alt Rally |
|---|---|---|---|
| Sept 2019 | 57% | DeFi Summer 2020 | ~5–6 months |
| Nov 2020 | 70% | The 2021 alt season (dominance fell 70% → 39%) | ~2–3 months |
| Nov 2022 | 48% | Brief alt rally into early 2023 | ~3 months |
| Apr 2026 | 60.6% | ? | ? |
The four specific catalysts that have preceded every historical rotation:
Bitcoin breaks above major resistance and consolidates sideways. This triggers profit-taking from BTC into higher-beta altcoins. Bitcoin is currently 38% below its ATH of $126,000, so the profit-rotation that fuels alt season has limited fuel until BTC reclaims at least $100,000.
Macro shifts from tightening to easing. Rate cuts expand liquidity, and altcoins benefit disproportionately as the highest-beta assets. The Fed is expected to hold through mid-2026 with 1–2 cuts priced for H2.
New narratives emerge that are altcoin-specific. DeFi Summer, NFTs, and Layer-1 competition gave capital a destination beyond Bitcoin. The 2026 candidates are AI blockchain infrastructure, RWA tokenization (which we cover tomorrow), and restaking protocols.
Regulatory clarity expands to altcoins. The CLARITY Act classified 16 tokens as digital commodities. Spot XRP ETFs are already live, with SOL and ADA staking ETFs pending. Each new ETF acts as a direct capital pipeline into that specific altcoin.
지난 6년간 모든 주요 알트코인 시즌은 BTC 도미넌스 피크 이후에 왔습니다. 피크와 알트코인 랠리 시작 사이의 시차는 2~6개월이었습니다 (위 표 참조).
모든 역사적 자금 회전에 선행한 네 가지 촉매: ①비트코인이 주요 저항선을 돌파하고 횡보 ②매크로가 긴축→완화로 전환 ③알트코인 전용 새 내러티브 등장 ④알트코인에 대한 규제 명확성 확대. 2026년 후보로는 AI 블록체인, RWA 토큰화, 리스테이킹, 그리고 CLARITY Act 하의 새 알트코인 ETF 승인이 있습니다.
What Should You Do Right Now? A Practical Framework
Here is a framework based on historical dominance cycles, not predictions:
If you are a beginner with no crypto yet: Start your DCA with a BTC-heavy allocation. During high dominance periods, 70–80% BTC and 20–30% ETH is a sensible starting split. Adding altcoins during Bitcoin season means buying them at a relative discount — but only if you have done your own research.
If you already hold altcoins: Do not panic-sell at peak dominance. Selling altcoins when dominance is at 60% is often selling near the bottom of their relative performance cycle. The historical pattern shows that this is the accumulation zone, not the exit zone. However, evaluate whether your specific altcoins have strong fundamentals. Dominance recovers for BTC and ETH every cycle. It does not recover for every altcoin — LUNA, FTT, and hundreds of others never came back.
If you want to prepare for altcoin season: Watch these three confirmation signals before rotating capital into altcoins:
- BTC dominance drops below 54% and holds for two consecutive weeks
- Altcoin Season Index moves above 40 and stays there for 2–3 weeks
- ETH/BTC ratio reclaims 0.035 on a weekly close
Until all three align, the disciplined move is to maintain a BTC-heavy allocation and treat altcoin positioning as early and speculative.
Track the data yourself: Bookmark TradingView BTC.D chart, BlockchainCenter Altcoin Season Index, and CoinGlass Fear & Greed Index. Check once per week, not daily. Record the readings in your trading journal.
역사적 도미넌스 사이클에 기반한 실전 프레임워크:
크립토가 아직 없는 초보자: BTC 비중 높은 DCA를 시작하세요. 높은 도미넌스 구간에서는 BTC 70~80%, ETH 20~30%가 합리적입니다. 비트코인 시즌에 알트코인을 추가하면 상대적 할인가에 사는 셈이지만, 자체 리서치를 먼저 하세요.
이미 알트코인 보유 중: 도미넌스 60%에서 패닉셀하지 마세요. 피크 도미넌스에서 알트코인을 파는 것은 상대적 성과의 바닥 근처에서 파는 것과 같습니다. 다만 내 알트코인의 펀더멘털이 강한지 평가하세요. BTC와 ETH는 매 사이클마다 회복하지만, 모든 알트코인이 그런 것은 아닙니다.
알트코인 시즌을 준비하고 싶다면: 세 가지 확인 신호를 기다리세요: ①BTC 도미넌스 54% 이하 2주 연속 유지 ②알트코인 시즌 지수 40 이상 2~3주 유지 ③ETH/BTC 비율 0.035 주간 종가 회복. 세 가지가 모두 정렬될 때까지 BTC 중심 배분을 유지하세요.
Quick Summary
Bitcoin dominance (BTC.D) measures Bitcoin’s share of the total crypto market cap. At 60.6% in May 2026, it is at its highest since March 2021 — the 3rd consecutive year of rising dominance. The drivers are institutional ETF flows ($96B AUM), fear-driven flight to quality (Fear & Greed at 39), and a collapsing ETH/BTC ratio (0.028→0.030). The Altcoin Season Index sits at 37–43, well below the 75 threshold for confirmed alt season. Historically, every dominance peak has been followed by an altcoin rally within 2–6 months — but only after specific catalysts align (BTC consolidation above resistance, macro easing, new narratives, regulatory clarity). The three confirmation signals to watch: dominance below 54% for 2 weeks, Altcoin Season Index above 40 sustained, and ETH/BTC above 0.035 weekly close. Until then, maintain a BTC-heavy allocation and accumulate, do not panic-sell altcoins at relative lows.
비트코인 도미넌스(BTC.D)는 전체 크립토 시가총액에서 비트코인의 점유율입니다. 2026년 5월 60.6%로 2021년 3월 이후 최고치이며, 3년 연속 상승 중입니다. 원인은 기관 ETF 유입($960억 AUM), 공포 기반 안전자산 선호(Fear & Greed 39), ETH/BTC 비율 붕괴(0.028→0.030)입니다. 알트코인 시즌 지수 37~43으로 확정 기준 75에 한참 못 미칩니다. 역사적으로 모든 도미넌스 피크 후 2~6개월 내 알트코인 랠리가 왔지만, 구체적 촉매가 정렬된 후에만 발생했습니다. 확인 신호 세 가지: 도미넌스 54% 이하 2주 유지, 알트코인 시즌 지수 40 이상 지속, ETH/BTC 0.035 주간 종가. 그때까지 BTC 중심 배분을 유지하고, 상대적 저점의 알트코인을 패닉셀하지 마세요.
Practice
Open TradingView BTC.D chart and note today’s dominance reading. Then open BlockchainCenter Altcoin Season Index and record the current score. Check the ETH/BTC ratio and write down whether it is above or below 0.035. Record all three in your trading journal. Compare your altcoin holdings’ performance against BTC over the last 90 days. If BTC outperformed every one of them, you now understand why — and you have the framework to know when that is likely to change. Set up your recurring BTC buy on Tapbit if you haven’t already.
TradingView BTC.D 차트를 열고 오늘 도미넌스를 기록하세요. BlockchainCenter 알트코인 시즌 지수를 열고 현재 점수를 기록하세요. ETH/BTC 비율을 확인하고 0.035 위인지 아래인지 적으세요. 세 가지를 모두 트레이딩 저널에 기록하세요. 내 알트코인 보유 종목이 지난 90일간 BTC 대비 어떤 성과를 냈는지 비교하세요. 전부 비트코인에 졌다면, 이제 그 이유를 이해했습니다 — 그리고 언제 바뀔 가능성이 있는지 판단할 프레임워크도 갖추게 되었습니다. 아직 하지 않았다면 Tapbit에서 BTC 반복 매수를 설정하세요.