이동평균선(MA)은 일정 기간의 평균 가격을 연결한 선으로, 가격의 전체적인 방향(추세)을 파악하는 데 사용됩니다. 대표적으로 단순이동평균(SMA)과 지수이동평균(EMA)이 있으며, 20일선은 단기, 50일선은 중기, 200일선은 장기 추세를 나타냅니다. 골든크로스(50일선이 200일선 위로 교차)는 강세 신호, 데스크로스는 약세 신호입니다. 이동평균선은 단독이 아니라 RSI, 지지·저항선과 함께 사용해야 정확도가 높아집니다.
If you have ever looked at a crypto chart and felt overwhelmed by the noise of price movements, a moving average is the tool that helps you cut through that noise. A moving average smooths out price data by calculating the average price over a specific number of days, creating a single flowing line on the chart that shows you the overall direction of the trend.
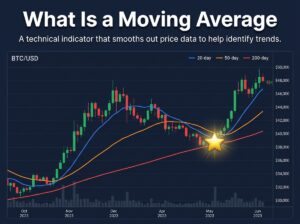
암호화폐 차트를 보면서 가격 움직임의 노이즈에 압도된 적이 있다면, 이동평균선이 그 노이즈를 걸러내는 도구입니다. 이동평균선은 특정 기간의 평균 가격을 계산하여 차트 위에 하나의 흐르는 선을 만들어, 전체적인 추세 방향을 보여줍니다.
Two Types of Moving Averages You Should Know
The Simple Moving Average, or SMA, takes the closing prices of a set number of days, adds them up, and divides by that number. For example, a 20-day SMA adds the closing prices of the last 20 days and divides by 20. Every day the oldest price drops off and the newest one is added, so the line moves with the market. The SMA treats every day equally, which makes it smooth but slightly slow to react to sudden price changes.
단순이동평균(SMA)은 설정된 기간의 종가를 합산하여 그 수로 나눕니다. 예를 들어 20일 SMA는 최근 20일의 종가를 합산하고 20으로 나눕니다. 매일 가장 오래된 가격이 빠지고 최신 가격이 추가되므로 선이 시장과 함께 움직입니다. SMA는 모든 날을 동등하게 취급하여 부드럽지만 급격한 가격 변화에 반응이 다소 느립니다.
The Exponential Moving Average, or EMA, gives more weight to recent prices. This means it reacts faster to new price movements. If Bitcoin suddenly drops $3,000 in a day, the EMA will reflect that change more quickly than the SMA. Many short-term traders prefer the EMA for this reason, while long-term investors often stick with the SMA for its stability.
지수이동평균(EMA)은 최근 가격에 더 많은 가중치를 부여합니다. 이는 새로운 가격 움직임에 더 빠르게 반응한다는 뜻입니다. 비트코인이 하루에 $3,000 급락하면 EMA는 SMA보다 더 빨리 그 변화를 반영합니다. 단기 트레이더 대부분이 이 이유로 EMA를 선호하고, 장기 투자자는 안정성을 위해 SMA를 고수하는 경우가 많습니다.
The Three Moving Averages Every Beginner Should Watch
You do not need to memorize dozens of settings. Three moving averages cover almost everything a beginner needs.
초보자가 수십 가지 설정을 외울 필요는 없습니다. 세 가지 이동평균선이면 거의 모든 것을 커버합니다.
The 20-day moving average shows the short-term trend. When Bitcoin’s price is above the 20-day line, short-term momentum is bullish. When it falls below, momentum is weakening. Day traders and swing traders use this line to decide when to enter or exit quick trades.
20일 이동평균선은 단기 추세를 보여줍니다. 비트코인 가격이 20일선 위에 있으면 단기 모멘텀이 강세이고, 아래로 떨어지면 모멘텀이 약해지고 있는 것입니다.
The 50-day moving average represents the medium-term trend. It is one of the most commonly watched lines by institutional traders. If Bitcoin is trading above its 50-day average, the market generally considers the mid-term outlook to be healthy.
50일 이동평균선은 중기 추세를 나타냅니다. 기관 트레이더들이 가장 많이 주시하는 선 중 하나입니다. 비트코인이 50일 평균선 위에서 거래되고 있다면, 시장은 일반적으로 중기 전망이 건강하다고 봅니다.
The 200-day moving average is the long-term trend indicator. This is the line that separates bull markets from bear markets in the eyes of most analysts. When the price stays above the 200-day line for an extended period, you are in a bull market. When it drops below and stays there, the market has shifted to bearish territory. Right now, with Bitcoin at $66,500 amid the Iran war uncertainty, watching where BTC sits relative to its 200-day moving average is especially important.
200일 이동평균선은 장기 추세 지표입니다. 대부분의 애널리스트들이 강세장과 약세장을 구분하는 기준선입니다. 가격이 200일선 위에 장기간 머무르면 강세장, 아래로 내려가서 머무르면 약세장입니다. 현재 이란 전쟁 불확실성 속에서 비트코인이 $66,500인 상황에서, BTC가 200일 이동평균선 대비 어디에 위치하는지 주시하는 것이 특히 중요합니다.
Golden Cross and Death Cross — The Two Signals Everyone Talks About
A Golden Cross happens when the 50-day moving average crosses above the 200-day moving average. This is widely considered a strong bullish signal because it means the medium-term momentum has overtaken the long-term trend, suggesting buyers are gaining control. Historically, Bitcoin has rallied significantly after Golden Cross events.
골든크로스는 50일 이동평균선이 200일 이동평균선 위로 교차할 때 발생합니다. 이는 중기 모멘텀이 장기 추세를 추월했음을 의미하여 매수세가 주도권을 잡고 있다는 강한 강세 신호로 널리 간주됩니다. 역사적으로 비트코인은 골든크로스 이후 상당한 랠리를 보여왔습니다.
A Death Cross is the opposite — the 50-day moving average crosses below the 200-day moving average. This signals that selling pressure has overwhelmed buying pressure over the medium term. While not every Death Cross leads to a major crash, it is a warning sign that traders should reduce risk exposure and tighten their stop-losses. For more on protecting your positions, check out our guide on How to Set a Stop-Loss and Protect Your Investment.
데스크로스는 반대입니다 — 50일 이동평균선이 200일 이동평균선 아래로 교차하는 것입니다. 이는 중기적으로 매도 압력이 매수 압력을 압도했다는 신호입니다. 모든 데스크로스가 대폭락으로 이어지지는 않지만, 리스크 노출을 줄이고 손절을 타이트하게 해야 한다는 경고 신호입니다.
How to Add a Moving Average on TradingView
Open TradingView, click the “Indicators” button at the top of the chart, and search for “MA” or “Moving Average.” Select “Moving Average” and it will appear as a line on your price chart. Click the settings gear icon to change the period — try 20, 50, or 200. You can add multiple moving averages at once by repeating this process. Use different colors for each line so you can quickly tell them apart.
TradingView를 열고 차트 상단의 “Indicators” 버튼을 클릭한 후 “MA” 또는 “Moving Average”를 검색하세요. “Moving Average”를 선택하면 가격 차트에 선으로 나타납니다. 설정 톱니바퀴를 클릭하여 기간을 20, 50, 200으로 변경해 보세요.
Common Beginner Mistake — Treating Moving Averages as Buy and Sell Commands
A moving average is a trend confirmation tool, not a crystal ball. When the price crosses above the 50-day MA, it does not automatically mean you should buy. The cross tells you the trend direction is shifting, but you should combine it with other indicators like RSI or support and resistance levels before making a decision. The best trades happen when multiple signals align — for example, when Bitcoin crosses above its 50-day MA while RSI is rising from the 30 zone and the price is bouncing off a known support level.
이동평균선은 추세 확인 도구이지 수정 구슬이 아닙니다. 가격이 50일 MA 위로 교차했다고 자동으로 매수해야 하는 것은 아닙니다. 교차는 추세 방향이 전환되고 있다고 알려주지만, RSI나 지지·저항선 같은 다른 지표와 결합한 후 결정해야 합니다. 최고의 거래는 여러 신호가 일치할 때 발생합니다.
If you’re looking for an exchange with solid charting tools to practice reading moving averages, Tapbit is a beginner-friendly option to start with.
이동평균선 읽기를 연습할 수 있는 차트 도구가 잘 갖춰진 거래소를 찾고 있다면, Tapbit이 초보자에게 친화적인 선택입니다.
Ready to start your crypto journey? Sign up for Tapbit and begin trading today.
Disclosure: This article contains affiliate links. We may earn a small commission at no extra cost to you.