RSI(상대강도지수)는 0~100 사이의 숫자로 자산이 과매수(70 이상) 또는 과매도(30 이하) 상태인지 알려주는 기술적 지표입니다. RSI를 읽는 법, 실전 활용법, 그리고 초보자가 흔히 저지르는 실수를 설명합니다. RSI는 단독이 아닌 다른 지표와 함께 사용할 때 가장 효과적입니다.
RSI stands for Relative Strength Index. It is one of the most popular technical indicators used by crypto traders around the world.
RSI는 상대강도지수(Relative Strength Index)의 약자입니다. 전 세계 암호화폐 트레이더들이 가장 많이 사용하는 기술적 지표 중 하나입니다.
It measures how fast and how much a price has moved recently, and gives you a number between 0 and 100.
최근 가격이 얼마나 빠르게, 얼마나 많이 움직였는지를 측정하여 0에서 100 사이의 숫자를 제공합니다.
This number helps you understand whether an asset might be overbought or oversold at any given moment.
이 숫자는 특정 시점에서 자산이 과매수 또는 과매도 상태일 수 있는지를 이해하는 데 도움을 줍니다.
What Do the Numbers Mean
When RSI is above 70, the asset is considered overbought. This means the price has risen quickly and may be due for a pullback or correction.
RSI가 70을 넘으면 자산이 과매수 상태로 간주됩니다. 가격이 빠르게 상승했으며 되돌림이나 조정이 올 수 있다는 의미입니다.
When RSI is below 30, the asset is considered oversold. This means the price has dropped sharply and may be ready for a bounce.
RSI가 30 아래이면 자산이 과매도 상태로 간주됩니다. 가격이 급격히 하락했으며 반등할 준비가 되어 있을 수 있다는 의미입니다.
When RSI is between 30 and 70, the asset is in a neutral zone. No strong signal in either direction.
RSI가 30에서 70 사이이면 자산은 중립 구간에 있습니다. 어느 방향으로든 강한 신호가 없는 상태입니다.
A Real-World Example
Imagine Bitcoin is trading at $72,000 and the RSI reads 78. This tells you that buyers have been very aggressive recently and the price has moved up fast.
비트코인이 $72,000에 거래되고 RSI가 78이라고 가정해 보세요. 이는 최근 매수자들이 매우 공격적이었고 가격이 빠르게 상승했다는 것을 알려줍니다.
It does not guarantee the price will drop, but it warns you that the upward momentum might be running out of steam.
가격이 반드시 하락한다는 보장은 아니지만, 상승 모멘텀이 힘을 잃어가고 있을 수 있다는 경고입니다.
Now imagine Bitcoin drops to $61,000 and the RSI reads 24. This tells you that sellers have pushed the price down hard and the selling pressure may be exhausting itself.
이제 비트코인이 $61,000으로 하락하고 RSI가 24라고 가정해 보세요. 매도자들이 가격을 강하게 밀어내렸고 매도 압력이 소진되고 있을 수 있다는 것을 알려줍니다.
Again, it does not guarantee a bounce, but it tells you the probability of a reversal is increasing.
다시 말하지만, 반등을 보장하지는 않지만 반전 확률이 높아지고 있다는 것을 알려줍니다.
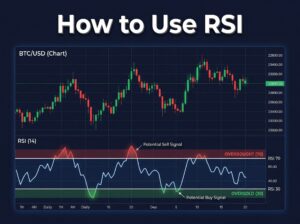
How to Find RSI on Your Chart
Most exchanges and charting platforms include RSI as a built-in indicator. On TradingView, click “Indicators” at the top, search for “RSI”, and add it to your chart.
대부분의 거래소와 차트 플랫폼에서 RSI를 기본 내장 지표로 제공합니다. TradingView에서는 상단의 “Indicators”를 클릭하고 “RSI”를 검색한 후 차트에 추가하면 됩니다.
RSI appears as a separate line below the main price chart. The default setting is 14 periods, which works well for most beginners. There is no need to change it.
RSI는 메인 가격 차트 아래에 별도의 선으로 나타납니다. 기본 설정은 14기간이며, 대부분의 초보자에게 잘 맞습니다. 변경할 필요가 없습니다.
You will also see two horizontal lines at 70 and 30. These are your overbought and oversold reference points.
70과 30에 두 개의 수평선도 보입니다. 이것이 과매수와 과매도 기준점입니다.
The Biggest Mistake Beginners Make with RSI
The most common mistake is treating RSI signals as automatic buy or sell triggers.
가장 흔한 실수는 RSI 신호를 자동적인 매수·매도 신호로 취급하는 것입니다.
RSI below 30 does not mean “buy now.” RSI above 70 does not mean “sell now.” In strong trends, RSI can stay overbought or oversold for days or even weeks.
RSI가 30 아래라고 “지금 매수”를 의미하는 것이 아닙니다. RSI가 70 위라고 “지금 매도”를 의미하는 것이 아닙니다. 강한 추세에서는 RSI가 며칠 또는 몇 주 동안 과매수나 과매도 상태에 머물 수 있습니다.
During the 2021 bull run, Bitcoin’s RSI stayed above 70 for extended periods while the price kept climbing. Anyone who sold just because RSI was overbought missed significant gains.
2021년 강세장에서 비트코인의 RSI는 가격이 계속 오르는 동안 장기간 70 이상에 머물렀습니다. RSI가 과매수라는 이유만으로 매도한 사람은 상당한 수익을 놓쳤습니다.
How to Use RSI the Right Way
Use RSI as confirmation, not as a standalone signal. Combine it with other information you already know.
RSI를 독립적인 신호가 아닌 확인 도구로 사용하세요. 이미 알고 있는 다른 정보와 결합하세요.
For example, if Bitcoin drops to a strong support level you identified on the chart, and RSI is also below 30, that gives you two reasons to consider buying instead of just one.
예를 들어, 차트에서 확인한 강한 지지선까지 비트코인이 하락하고 RSI도 30 아래라면, 하나가 아닌 두 가지 이유로 매수를 고려할 수 있습니다.
If you want to review how support levels work, check out How to Set a Buy Target Using Charts.
지지선이 어떻게 작동하는지 복습하고 싶다면, 차트를 이용한 매수 목표 설정법을 확인하세요.
Similarly, if a coin hits a resistance zone and RSI is above 70, that is two signals suggesting caution.
마찬가지로, 코인이 저항 구간에 도달하고 RSI가 70 이상이라면, 이는 두 가지 신호가 주의를 시사하는 것입니다.
RSI Divergence — An Advanced Clue
There is one more useful concept called RSI divergence. This happens when the price makes a new high but RSI makes a lower high, or the price makes a new low but RSI makes a higher low.
**RSI 다이버전스(발산)**라는 유용한 개념이 하나 더 있습니다. 가격이 새 고점을 만드는데 RSI는 더 낮은 고점을 만들거나, 가격이 새 저점을 만드는데 RSI는 더 높은 저점을 만들 때 발생합니다.
Divergence often signals that the current trend is weakening. It is not a perfect predictor, but it is worth paying attention to as you gain more experience.
다이버전스는 현재 추세가 약해지고 있다는 신호인 경우가 많습니다. 완벽한 예측 도구는 아니지만, 경험이 쌓이면서 주의를 기울일 가치가 있습니다.
For now, just remember the basics: above 70 means caution, below 30 means opportunity might be near, and always confirm with other data before acting.
지금은 기본만 기억하세요: 70 이상은 주의, 30 이하는 기회가 가까울 수 있음, 그리고 행동하기 전에 항상 다른 데이터로 확인하세요.
If you want to practice reading RSI in real time, Tapbit offers built-in charting tools where you can add RSI and other indicators to any trading pair.
실시간으로 RSI를 읽는 연습을 하고 싶다면, Tapbit에서 어떤 거래 페어에도 RSI 및 기타 지표를 추가할 수 있는 내장 차트 도구를 제공합니다.
Ready to start your crypto journey? Sign up for Tapbit and begin trading today.
암호화폐 여정을 시작할 준비가 되셨나요? Tapbit에 가입하고 지금 바로 거래를 시작하세요.
Disclosure: This article contains affiliate links. We may earn a small commission at no extra cost to you.